A fast-casual Greek restaurant on a leading university campus in the American West
Nothing of this kind traded on this site before 23 September 2024. An operator with thirty years of full service — and no fast-casual format, no campus and no two-minute kitchen behind him — drew the room, the order flow and the menu, opened it inside a research building on that campus, and runs it: kiosk-ordered, no cashier, no cash, no paper, a median ticket under two minutes, three-quarters of the trade from people who come back.
BRIEFTERRITORY
Three things in this document had never been done by its operator before September 2024: a fast-casual format; a restaurant on a university campus; a kitchen measured in seconds rather than courses. Thirty years of full service, a Michelin star among them, supplied the discipline and none of the format. What follows is what transferred, what had to be built from nothing on this site, and what it measures at now.
The invitation was a question: would the operators of a fast-casual Greek restaurant in Palo Alto put a version of it inside a research building on the university's campus? The answer was yes, a partnership was formed, and the history of the space set the brief. The previous occupant had failed, and by most accounts had failed on one thing: speed. The volume a research building produces at lunch could not be served fast enough, the queues and the frustration did the rest, and the university decided to change tenant.
So the brief was time. A campus does not eat in a curve; it eats in a spike, because classes and lab schedules end at once and several hundred people arrive in the same fifteen minutes wanting to leave in the next fifteen. Everything that follows is an answer to that.
Two things were known and three were not. Known: the customer (researchers, faculty, students) would be in a state of mind that tolerates, even prefers, a self-guided system. Known: in-person order-taking, whether a cashier or a server, is where fast-casual loses its minutes and makes no sense at this volume. Not known: whether people would eat in or take away, so the operation was built take-away first with a dining room attached, which turned out to be the right call. Not known: what the kitchen would have to hold to survive the spike. Not known, honestly, whether thirty years of full-service discipline would transfer to a format the operator had never run.
The constraints the agreement set
The university's terms shaped the design as much as the room did. A five-year services agreement; occupancy at 2.5% of gross revenue from year two, nothing in year one, utilities inside it: electrical, water, sewer, telephone. An indoor footprint of 2,451 square feet including the back rooms. All take-away packaging compostable, as a term rather than a preference. And a pricing clause: material price increases or menu changes need the university's approval. The sister property's list prices were not available here; the proposal that won the space priced the core menu 28.8% below them, and two years of permitted increases have closed that to 20.9%. That concession is the other side of a 2.5% occupancy line, and it is priced into everything in Section IV.
What transferred, and what did not
The space came with a finished commercial kitchen (two combi ovens, a six-burner range, broiler, griddle, fryer, a door-type dishwasher, hot holding, refrigerated prep and display, espresso, even a draft-beer tower) and with partial equipment from the previous occupant. The operator added a vertical grill, a tilt skillet, a mixer, kiosks, displays and a point of sale. The doors opened on 23 September 2024, three and a half weeks after the agreement was executed.
What transferred from full service was the discipline: stations that hold their own mise, holding standards written per item, de-skilling through preparation rather than through cheaper people, and the habit of measuring before asserting. What did not transfer was everything the guest is normally given time to do: the greeting, the conversation, the order taken at the table, the cheque. In a dining room the guest's time is the asset. Here it is the constraint, and the design removes every place it could be spent.
FRICTIONFLOW
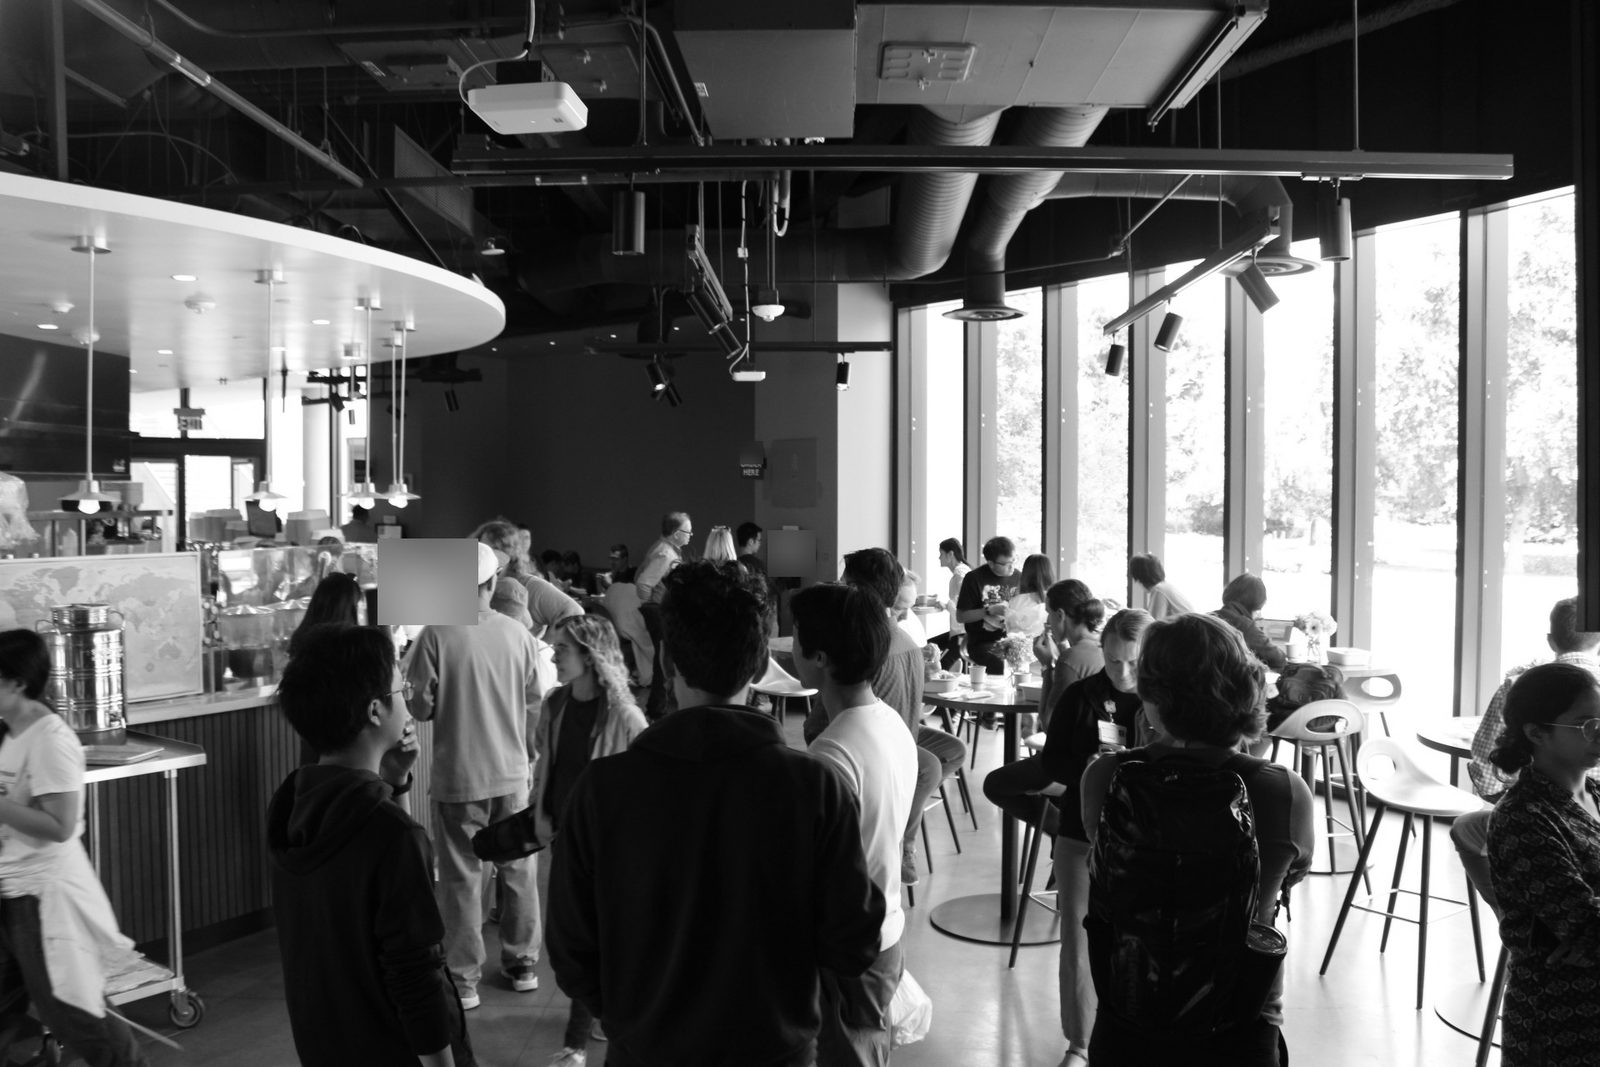
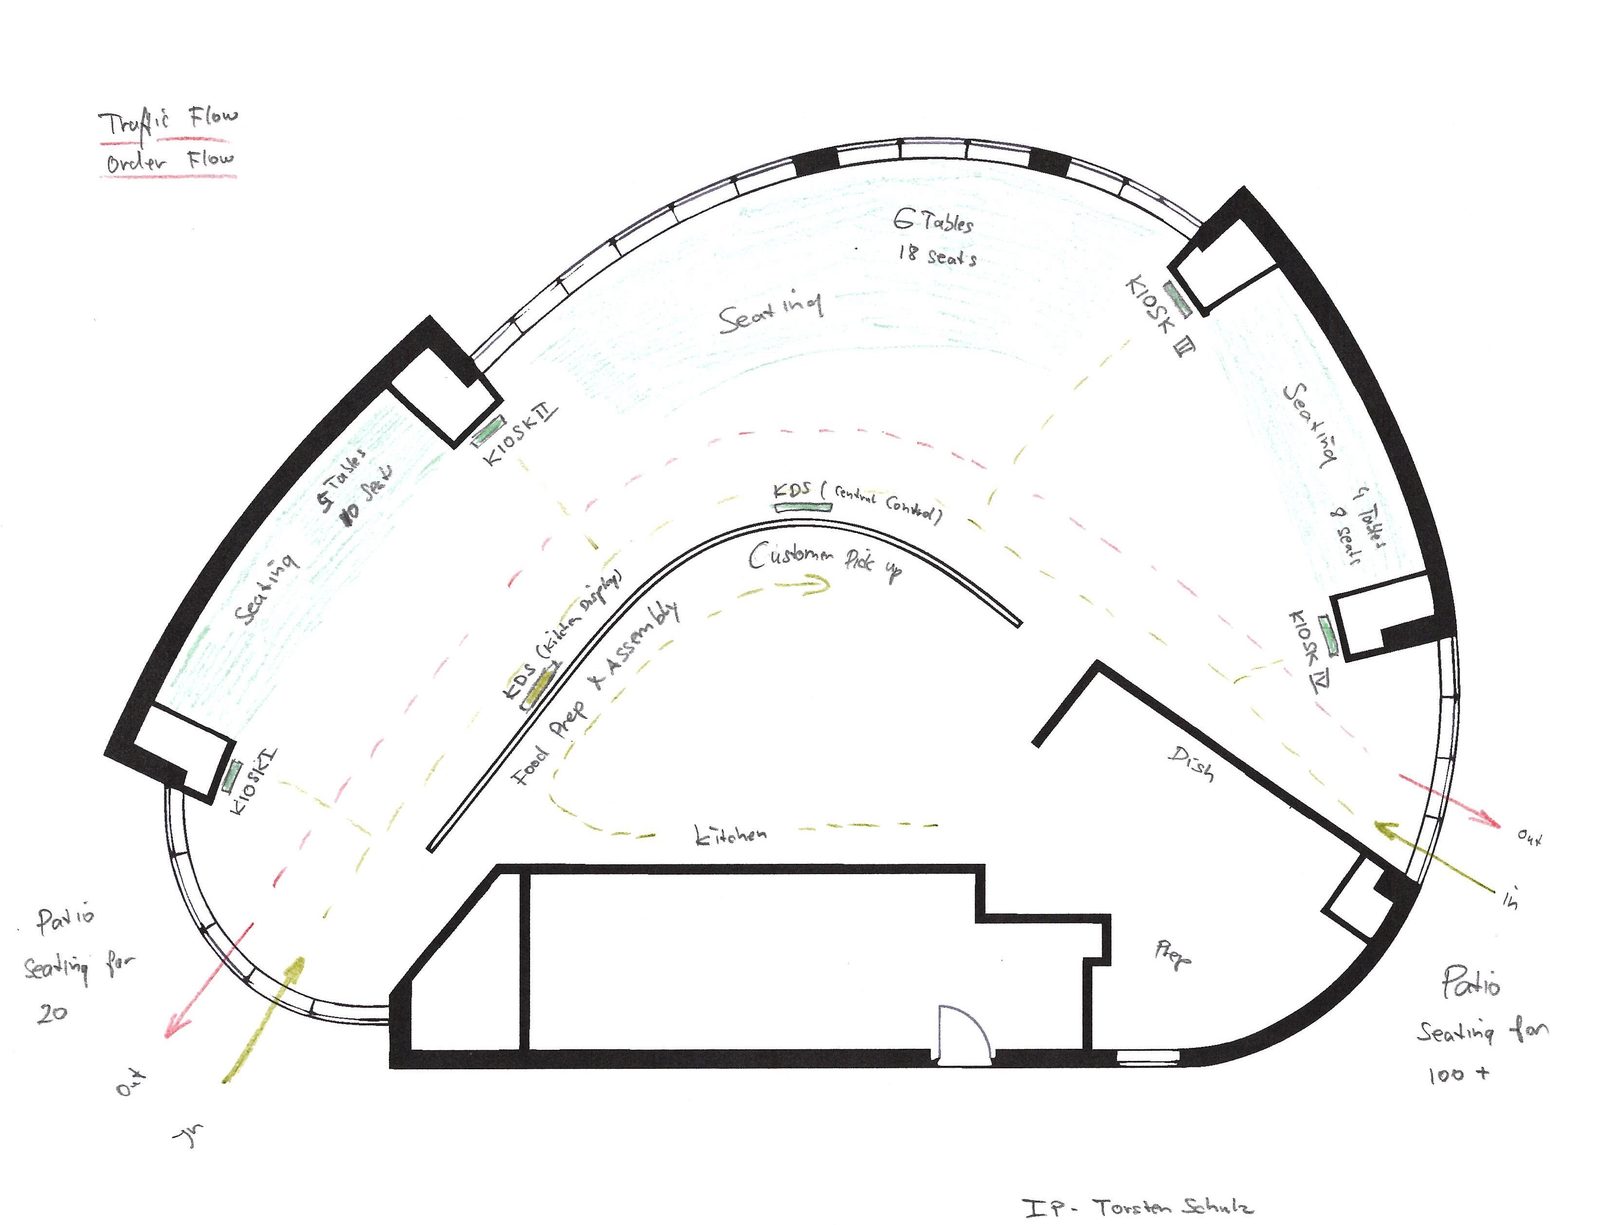
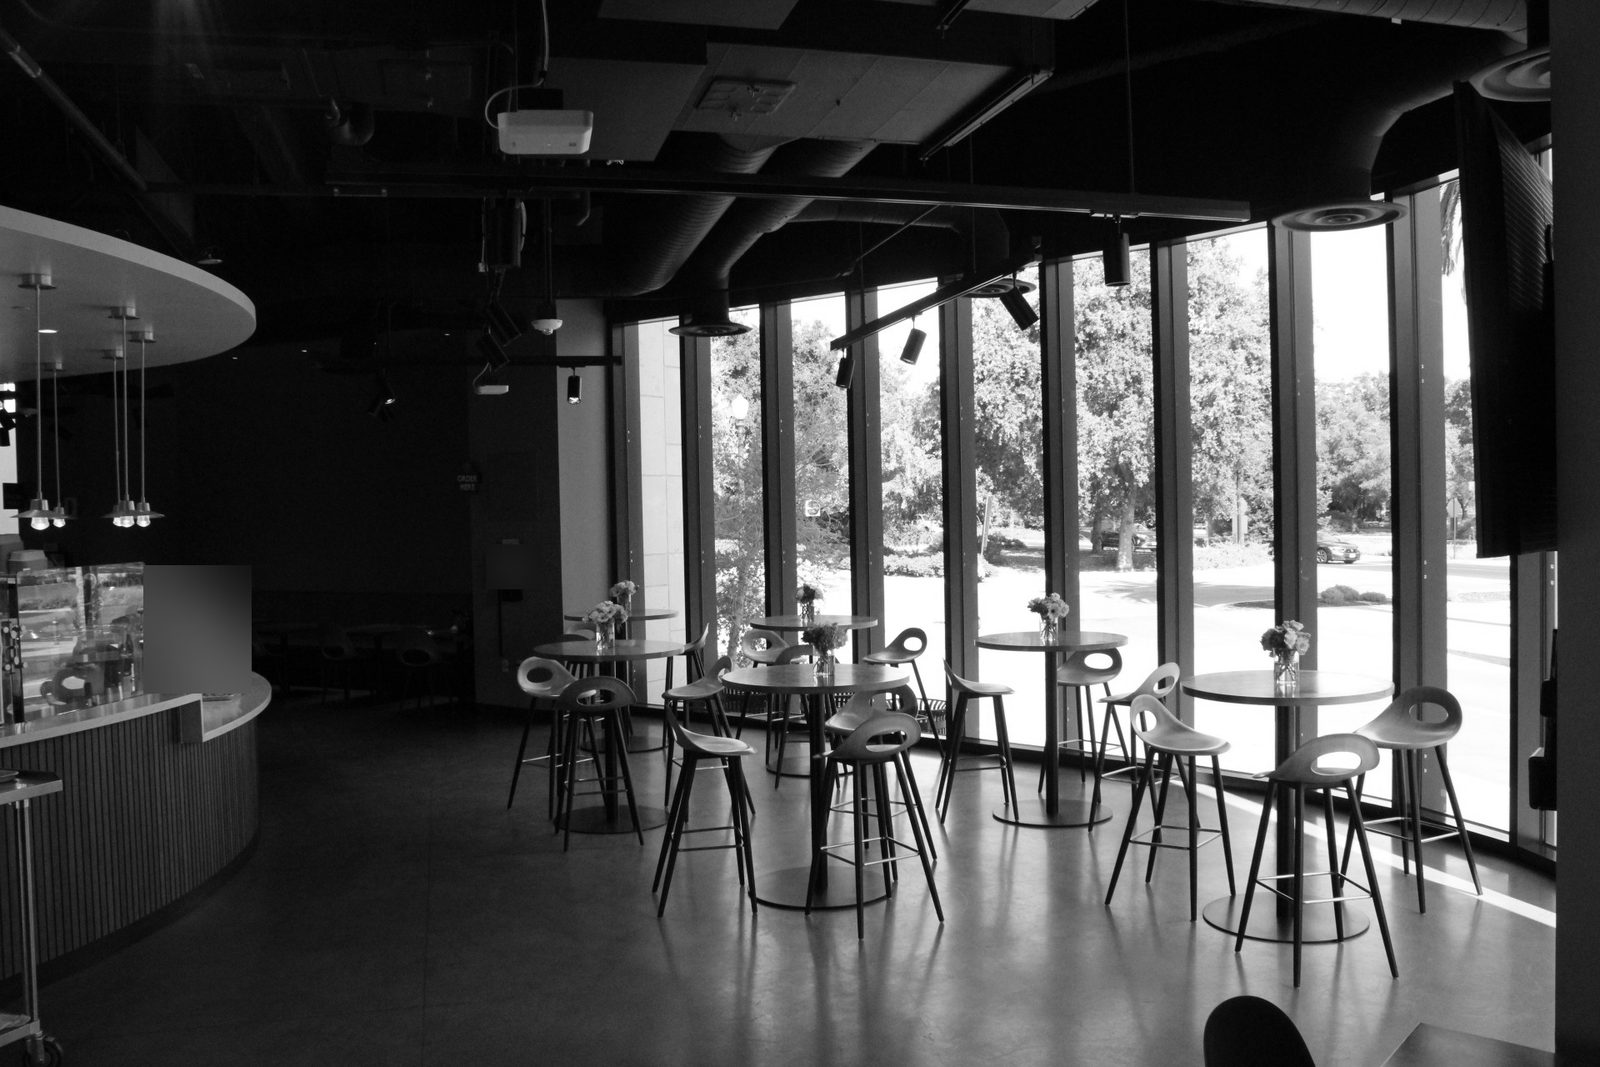
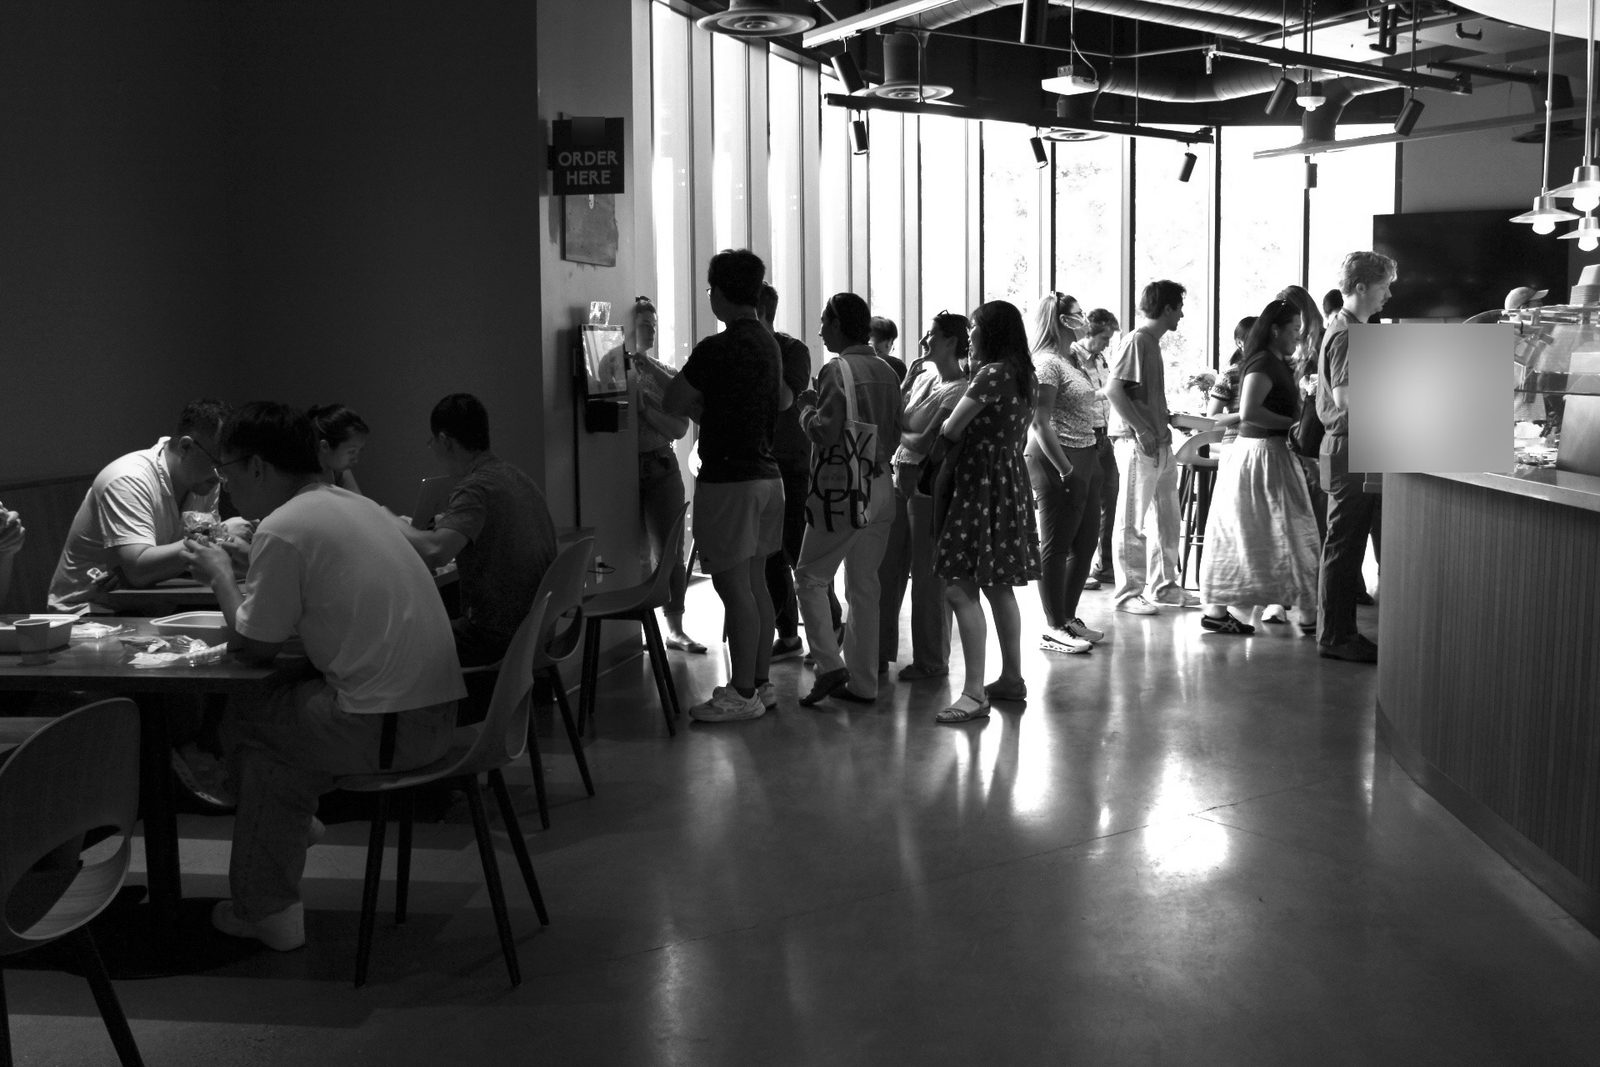
The room is a crescent with a kitchen block behind it and four structural columns in the dining space. The columns became the order points: kiosk one and two at the primary entrance, three and four at the secondary, each entrance leading to a patio. Thirty-six seats inside at fifteen tables; about a hundred on the main patio and twenty on the small one. People come in from the left and the right, order at the nearest column, and either wait, sit, or go back outside until their phone tells them to return.
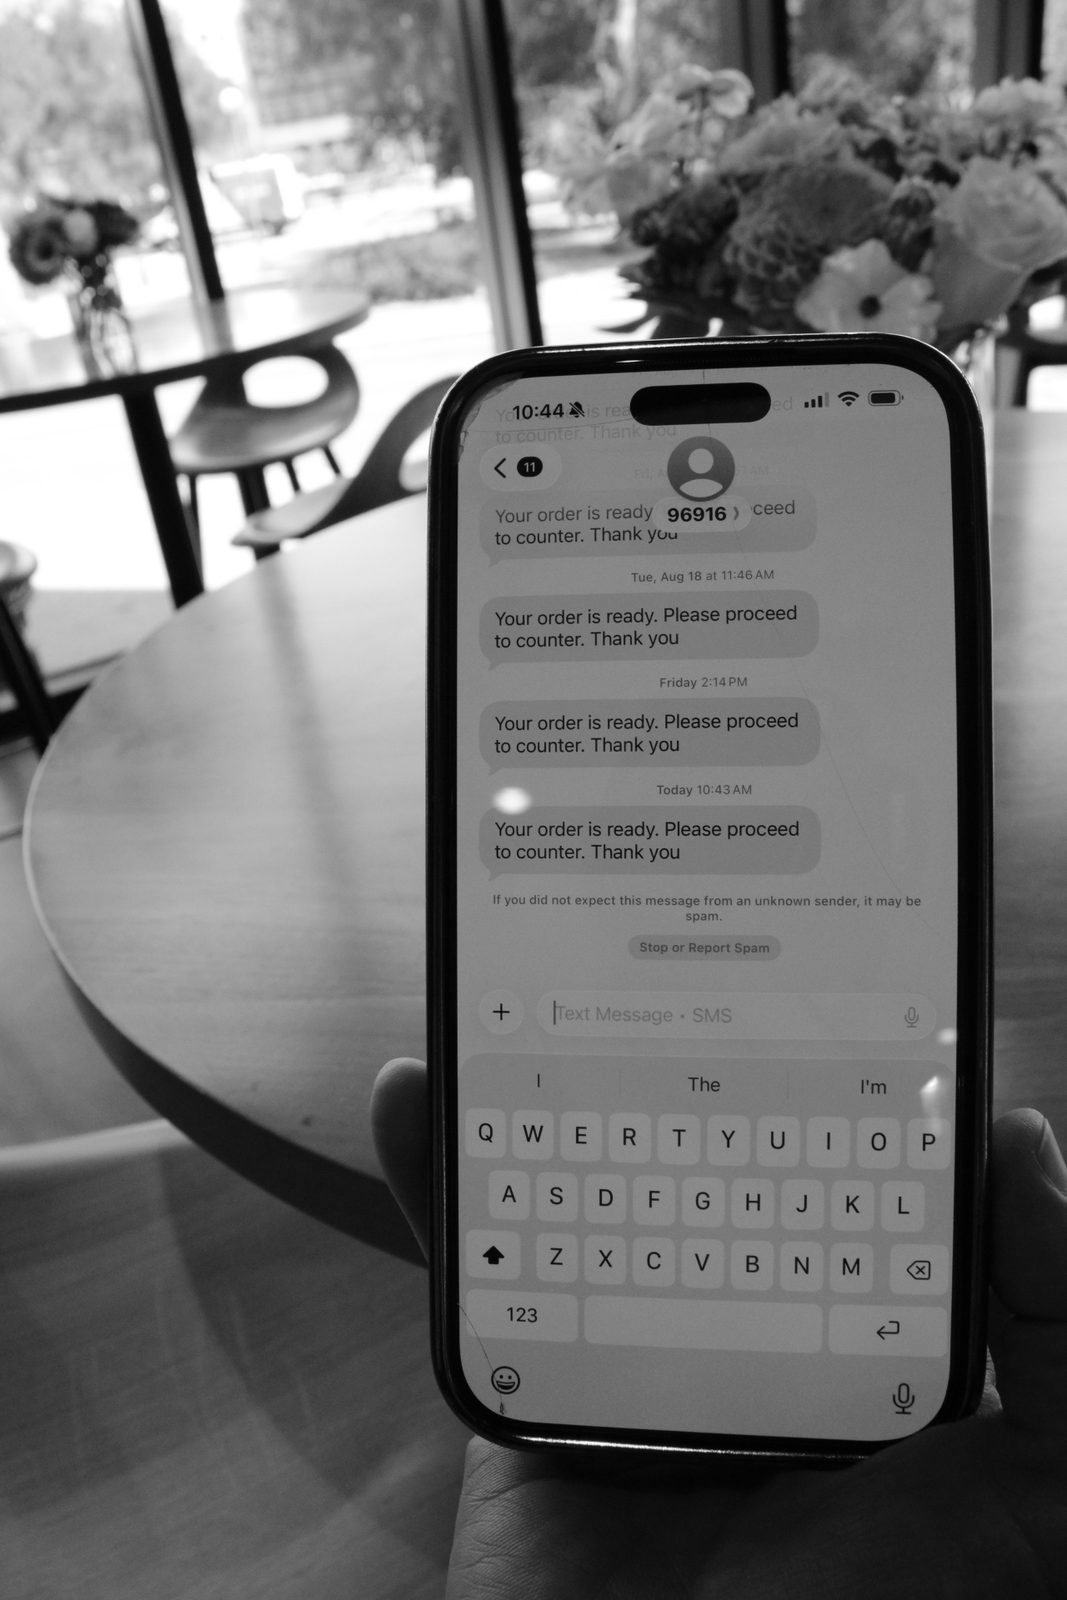
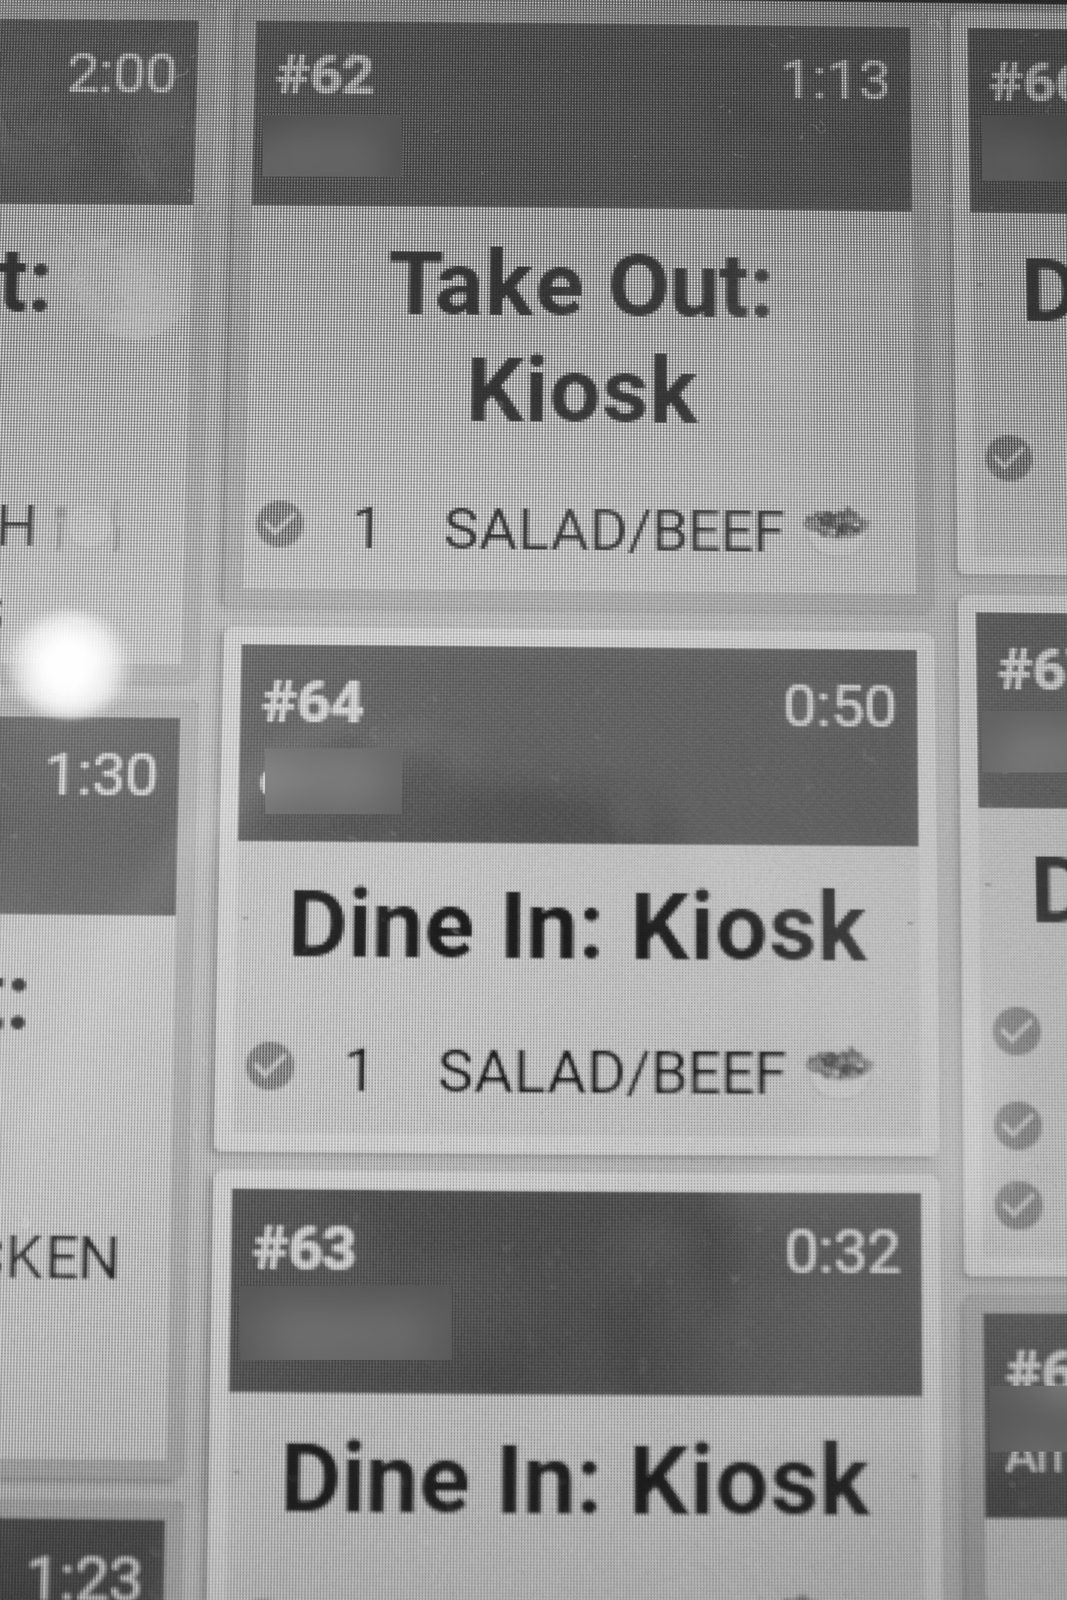
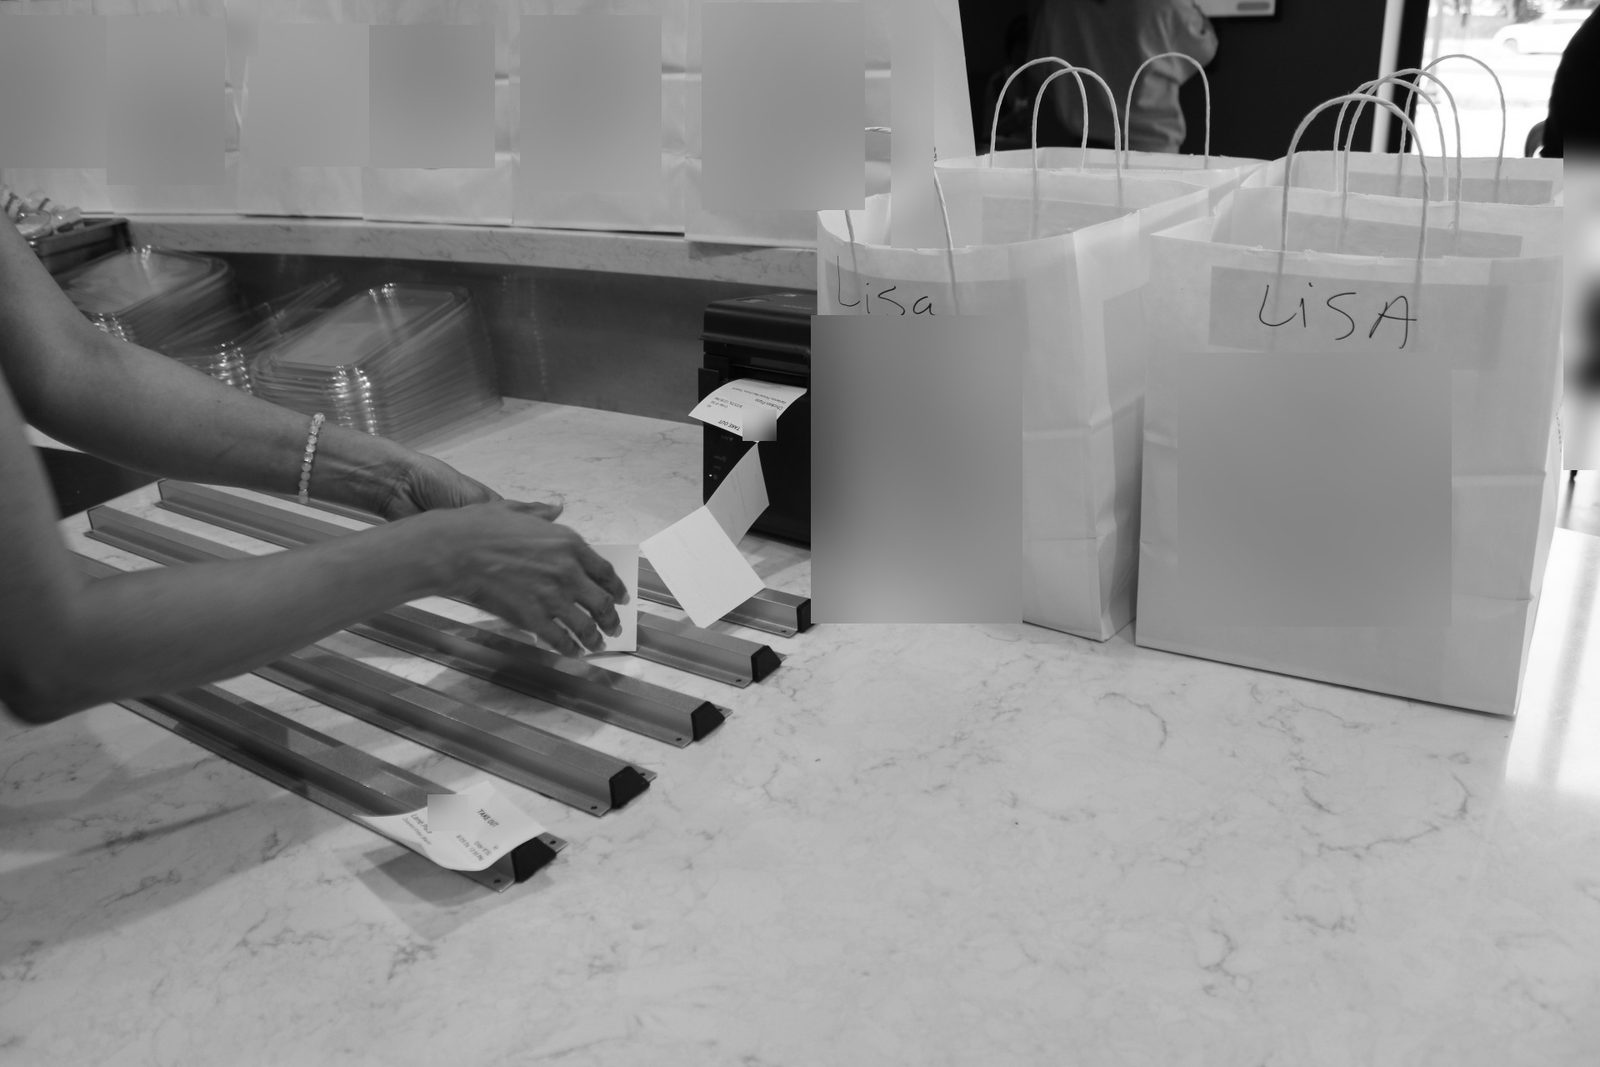
Behind the line the kitchen is drawn so that nobody moves. A prep kitchen produces components. One hot-supply cook cooks them (grilled chicken and beef held on the line for twenty to thirty minutes without loss, gyro carved and held up to fifteen, fish fried and held about five) and pumps them into a single curved assembly line occupied by two cooks. Those two look at a display, not at a ticket, and not at a person. The display is fed by the four kiosks. A finished box slides down the counter to an attendant who labels it, then to a second attendant at a control display who marks it fulfilled, fires a text to the guest, and puts it on the pick-up counter. There is no printer in the sequence, no expediter, and no one is required to speak. The one voice permitted is a name called when a guest does not answer their phone.
| Guest touchpoint | Operational effect | |
|---|---|---|
| 0 s | Order placed and paid at one of four kiosks: rewards prompt, item, modifiers, payment. About a minute on the screen for a first-timer; regulars are faster. | A digital ticket appears on the assembly-line display. No printer, no expediter, no one speaks. |
| 10 s | The assembly cook reads the modifiers off the screen and builds the box from held, pre-cut, pre-cooked components, then slides it down the counter. | |
| 30 s | A counter attendant labels the lid and passes the box to the control station. | |
| 40 s | The guest's phone buzzes. | On the control display the order is marked fulfilled, the text goes out, the box goes onto the pick-up counter. |
| 45 s | The guest collects. The only words spoken in the whole sequence are a name called at the counter. | The design case, and it happens: one ticket in fifteen clears inside forty-five seconds. |
The measured norm, across 74,755 tickets in two six-month windows a year apart, May to November 2025 and February to August 2026, is a median of 1 min 54 s from the ticket firing to the guest's name being called: half inside two minutes, three-quarters inside three, 96% inside the six-minute standard the operation sets for itself. Everything the kitchen does in that time was decided before the door opened: what is held, at what temperature, for how long; which cook touches which component; where the box goes next. The speed comes from the absence of the things that would otherwise consume the time: paper, questions, steps.
| The operating system | Figure | Source |
|---|---|---|
| Order points | 4 kiosks, 0 cashiers, no cash | Operator; plan |
| Kitchen display screens | 2 — assembly line and control station | Plan |
| Paper tickets | None in the normal sequence | Operator |
| Roster | 12 people; 8 on a lunch shift | Operator |
| Tickets a day | 267 on an average trading day May-Nov 2025, 313 Feb-Aug 2026; busiest days 361 (1 Oct 2025) and 400 (12 Mar 2026); weekdays only | KDS exports |
| The peak | 115 to 124 tickets in the busiest sixty minutes of an average day, from about 11:50 — roughly 210-225 items at the point of sale's 1.8 per order; 170 on the best days of both windows; the noon hour carries 38-41% of the day | KDS exports; product mix |
| Seats | 36 inside at 15 tables; 100 and 20 on two patios | Plan |
| Trading hours | Monday-Friday 09:00-17:00; about 247 trading days a year — closed 22 December to 2 January and on the main public holidays | Operator; calendar rule checked against the KDS exports |
| Ticket time, fired to cleared | Median 1 min 54 s across 74,755 tickets (1 min 51 s in the 2025 window, 1 min 56 s in 2026); three-quarters inside three minutes, 96% inside the six-minute standard; 4% over it | KDS exports |
| Wholesale, alongside retail | 26,359 units invoiced in 2025 to a hospital cafe account, outside the point of sale | Invoices |
| Indoor footprint | 2,451 sq ft including the back rooms | Services agreement |
Operator figures are stated as the operator's. Per-ticket and per-hour lines are measured from two KDS fulfilment exports — 1 May to 3 November 2025 and 25 February to 21 August 2026; the annual lines above the table are calendar 2025.
PEAKPACE
The operation trades Monday to Friday, nine to five, and the campus eats between twelve and one. Off-peak, everybody preps and everybody tends the line; at the peak, the roster is the eight people the drawing needs.
The kitchen display system measures the day. Across 127 trading days from late February to late August 2026 the shape is this: 313 tickets on an average day, 400 on the busiest; the twelve o'clock hour alone carries 37.8% of them, and the two hours either side of noon carry 71%. The busiest sixty minutes of an average day, starting around ten to twelve, bring 124 tickets, 31 per kiosk, one every two minutes at each screen; the best day brought 170. The same export for May to the start of November 2025 (131 trading days, 35,015 tickets) has the same shape a year earlier: 267 tickets a day, the noon hour at 41%, a peak hour of 115 and a best of 170. Like for like, May to August, the load rose 15% between the two years, from 267 tickets a day to 307, and the median ticket moved two seconds, from 1 min 50 s to 1 min 52 s. At the point of sale's 2025 averages of 1.8 items and about one main to an order, that hour is roughly 125 mains and 225 items on an average day and some 300 items on the best; the three hours from eleven clear about 220 tickets: the two hundred-odd people the operator quotes for the crunch, fed at about one main each.
The operator's position was that load does not slow the line: a hundred or five hundred, the wait is the same. Measured, the kitchen is fastest when it is busiest. In hours carrying fewer than 25 tickets the median ticket clears in 2 min 36 s; at 100 to 124 tickets an hour it clears in 1 min 34 s; at 150 and more, 2 min 03 s, still quicker than the quiet hours. The 2025 window draws the same curve: 2 min 09 s, 1 min 43 s, 1 min 52 s. The reason is in the roster: off-peak everyone is prepping and a lone ticket waits for a pair of hands; at noon eight people are on the line and nothing else is happening.
| Hour fired | Tickets, per trading day | Share of the day | Median ticket | 90th percentile |
|---|---|---|---|---|
| 09:00 | 6 | 2.0% | 2 min 57 s | 7 min 00 s |
| 10:00 | 12 | 3.9% | 2 min 40 s | 6 min 44 s |
| 11:00 | 49 | 15.5% | 1 min 52 s | 4 min 51 s |
| 12:00 | 118 | 37.8% | 1 min 39 s | 3 min 56 s |
| 13:00 | 54 | 17.4% | 1 min 59 s | 4 min 11 s |
| 14:00 | 34 | 10.7% | 2 min 10 s | 4 min 38 s |
| 15:00 | 23 | 7.2% | 2 min 17 s | 4 min 56 s |
| 16:00 | 17 | 5.3% | 2 min 51 s | 6 min 20 s |
KDS fulfilment export, 39,740 tickets over 127 weekday trading days, 25 February to 21 August 2026. The hour with the most tickets has the fastest median; the quiet hours at either end of the day are the slowest. The May-November 2025 export (35,015 tickets) has the same shape — the noon hour at 110 tickets a day and a median of 1 min 44 s, the nine o'clock hour at 2 min 24 s — and is held in the front matter. Thirty-one tickets (0.1%) fired outside 09:00-17:00 are omitted from the rows and kept in the totals.
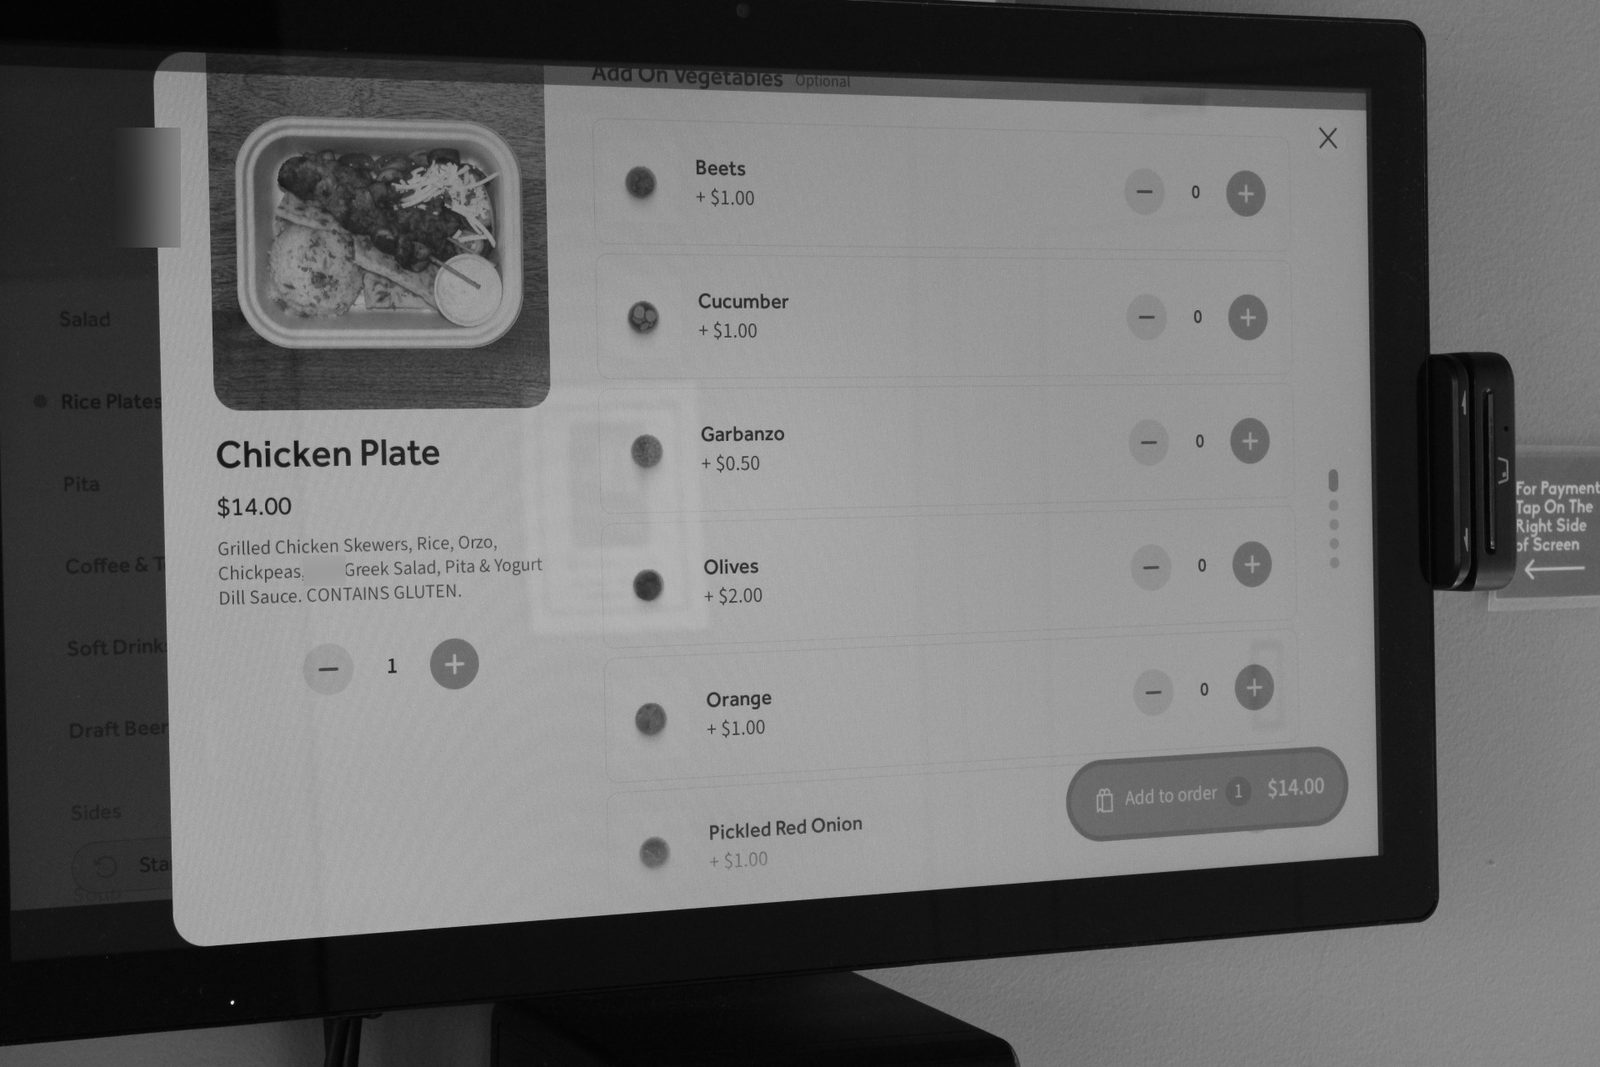
What is measured is the year. 63,849 retail orders in calendar 2025, the first full year, at an average of $20.05 and 1.82 items per order. The proposal that won the space had modelled three service scenarios at $12, $15 and $18 a head and a first full year of $1,069,590 in net sales; the point of sale recorded $1,278,392, 19.5% above the projection, at an average order above all three scenarios. A kiosk that carries ninety-five per cent of the options does not talk a guest down; it lets them build the plate they wanted.
The kitchen sells more than the kiosks do. Since January 2025 a wholesale account the sister property had served since 2020, a weekly order for a hospital cafe on the medical campus, has belonged to this operation and been produced from this kitchen, alongside the retail trade and outside the point of sale. 26,359 units were invoiced in 2025, $257,837, on 23 fortnightly invoices. A catering menu took a further $148,613 through the point of sale in 2025, 11.6% of retail, with October its season: the campus's event calendar, including an 800-cover corporate event on the first of the month that this kitchen served in 2024 and 2025 and is booked for again, on a day the kiosks also did 361 tickets, the busiest of the 2025 window. Total net sales for the first full year are therefore $1,536,229: $1,278,392 at retail and $257,837 wholesale. On about 247 trading days (Monday to Friday, closed over the year-end fortnight and on the main public holidays) that is roughly 260 retail orders and $6,200 of sales a trading day, about $780 an open hour, derived from the annuals rather than measured. The proposal's projection is compared with the retail figure, because the cafe is what it modelled. On 2,451 square feet of indoor space, five days a week, eight hours a day, with prices held a fifth below the sister property's list, that is $627 of sales per square foot.
The kiosk as governor
Six kiosks were planned; four were installed and the other two deliberately never were. Four kiosks are a ceiling on how fast orders can enter the system, and at the peak each carries a queue of ten or twelve. That is bad for the person at the back of the queue and good for the kitchen, because the line never receives more than it can clear. The same logic runs online: orders are slotted to a ticket time, and at the busiest minutes the system throttles or closes order flow automatically. Demand is paced at the door, not absorbed in the kitchen.
The cost of pacing is occasionally visible on the pick-up counter. Text fulfilment brings people back quickly; not quite quickly enough at the worst minute, and boxes can stack. The fix was unglamorous and correct: bags, a name written on each by hand, collected without a word.
Who comes back
The best measure of whether the system is tolerated is whether people return to it. Seventy-five per cent of 2025 retail net sales came from enrolled rewards members, and 82.3% of orders: a population that knows the kiosk, knows the menu and knows the place is fast. Into 2026 the share is higher still, at 78.8% of sales through August.
The calendar shows in the numbers, and the design has to survive it. May, the strongest ordinary month, ran at 1.6 times December, the weakest; October, the catering month, stood above both. Against that shape, the same seven months of 2026 ran 9.7% ahead of 2025. A second year that grows on a campus with a fixed population is repeat custom. It is more orders, not bigger ones: tickets a day rose 15% like for like while the average retail order eased to $18.61 for 2026 to date against $20.05 in 2025, every month of the year below the old average. Prices did not move and baskets did not shrink (1.8 items an order in both years), so the shift is in what is ordered, toward the cheaper end of the grid. A price move is the lever for that, and one is planned (Section VI).
SKUYIELD
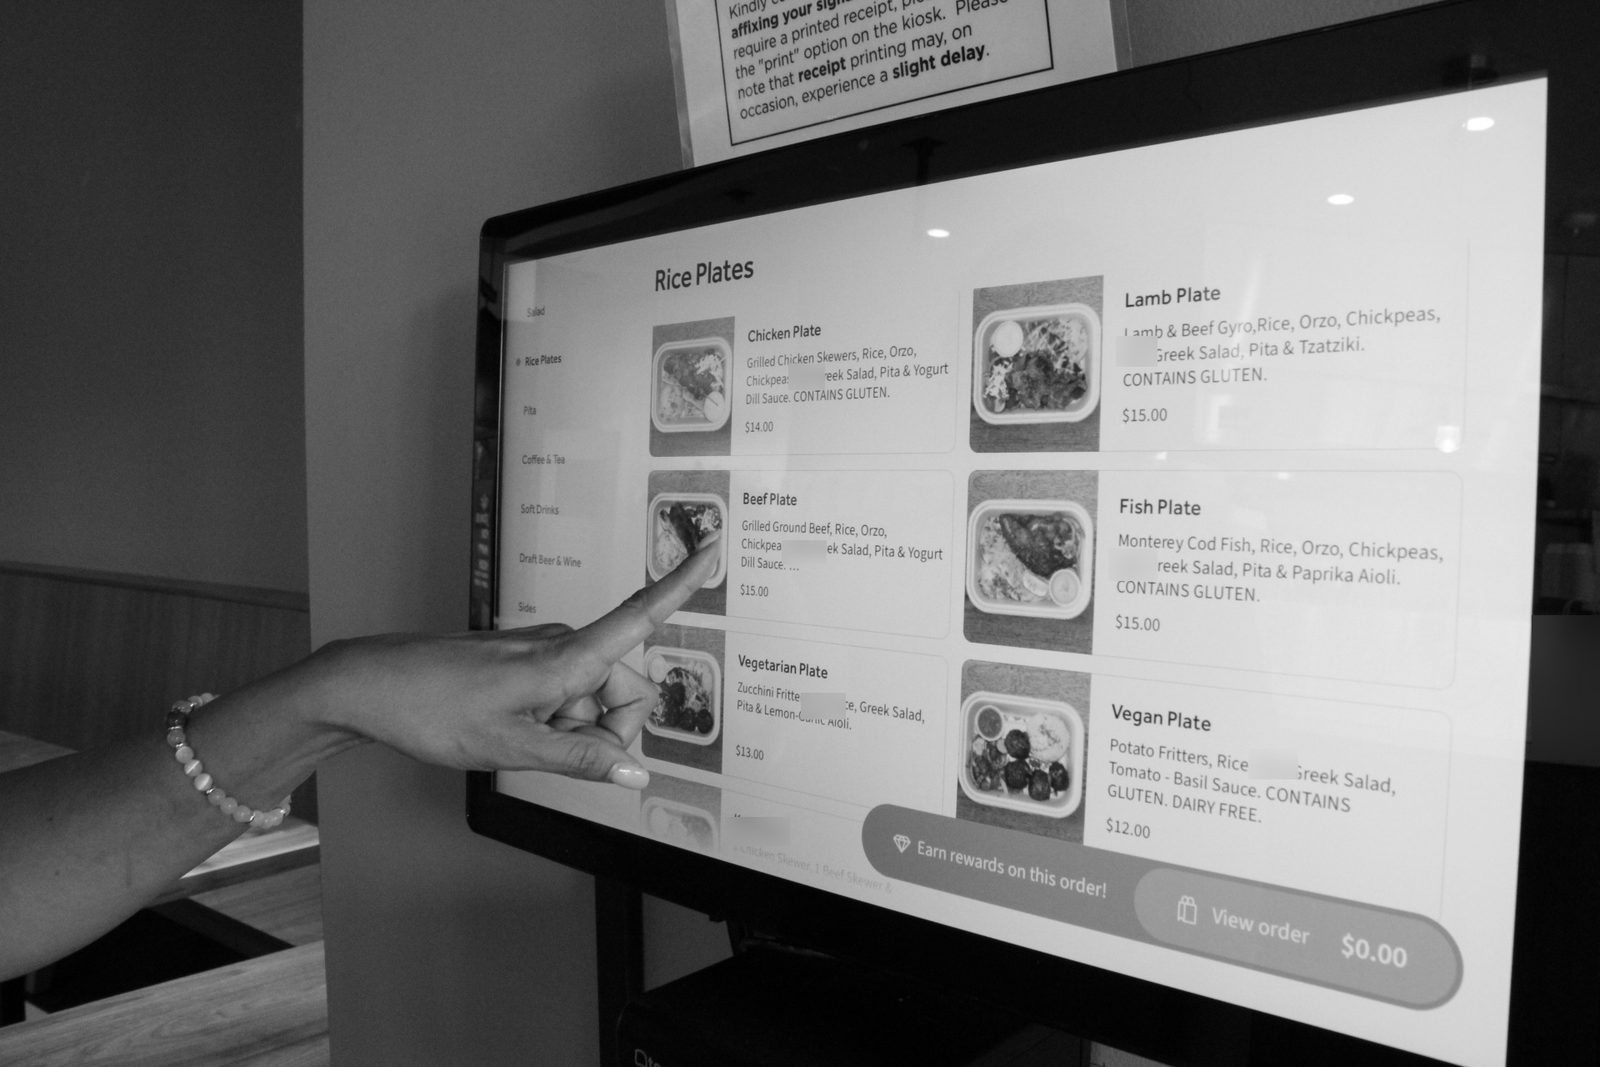
The menu is three formats (pita, salad, plate) across six proteins, and it carries the building. Eighteen items took 64.1% of retail net sales in 2025; the three format groups together, 71.7%. Guests add and remove proteins, vegetables, sauces and starches as they please and it does not disturb the workflow, because every combination is an assembly of the same held components. The firm is named for a ratio, and here it is literal: 26 of 132 items sold carried 80% of retail sales. Eight carried half.
| Protein | Pita | Salad | Plate | Units, 2025 | Net sales |
|---|---|---|---|---|---|
| Chicken | 3,042 | 5,268 | 11,363 | 19,673 | $267,838 |
| Lamb | 2,737 | 3,240 | 6,884 | 12,861 | $186,036 |
| Fish | 1,274 | 3,361 | 6,766 | 11,401 | $165,493 |
| Beef | 998 | 1,530 | 3,426 | 5,954 | $86,701 |
| Vegetarian | 1,362 | 1,695 | 3,138 | 6,195 | $78,268 |
| Vegan | 807 | 991 | 1,148 | 2,946 | $34,789 |
| Eighteen items | 10,220 | 16,085 | 32,725 | 59,030 | $819,125 — 64.1% of retail net sales |
Main menu only, calendar 2025, Toast product mix. The house platter, a pork pita special and the happy-hour and catering menus sit outside the grid; with them the three format groups carry 71.7% of retail net sales.
The arithmetic of the line is the arithmetic of holding. Lettuce and vegetables are cut ahead and held cold; eight sauces are produced and held cold; the proteins are pre-cooked to a standard that survives twenty to thirty minutes on the line, and in the case of the grilled chicken and beef, improves in it. Pre-cooking is cut back after the peak so the hold does not become waste. Roughly eighty per cent of what is served is made from scratch in the building; the de-skilling is in the timing and the station, not in buying the food finished.
Two decisions about the guest simplified the kitchen more than anything on the menu. First, there is no dine-in product. Everything is packed to go, in the compostable packaging the agreement requires; the only difference for a guest who sits is whether the box waits on the counter or behind it. Second, the kiosk carries about ninety-five per cent of the options a guest could want, so the questions that would otherwise be asked at a counter are asked of a screen. Perhaps one guest in a thousand looks for the gap in the system and puts an impossible question to a person. That guest is not well served. The other nine hundred and ninety-nine are.
Price, and what it costs
| Item | Proposed, Feb 2024 | Realised, 2025 | Sister property, list | Below list |
|---|---|---|---|---|
| Chicken plate | $13.00 | $14.59 | $18.00 | 18.9% |
| Lamb plate | $14.00 | $15.48 | $20.00 | 22.6% |
| Fish plate | $14.00 | $15.46 | $21.00 | 26.4% |
| Chicken salad | $12.00 | $13.60 | $17.00 | 20.0% |
| Vegetarian plate | $13.00 | $13.52 | $17.00 | 20.4% |
| Chicken pita | $11.00 | $12.36 | $14.00 | 11.7% |
| Eighteen core items, weighted by 2025 volume | 28.8% below list | 20.9% below list | 20.9% |
Realised price is gross item amount over quantity on the main menu, so it includes whatever upcharges the kiosk applied. The proposal priced the grid 28.8% below the sister property's current list; permitted increases since opening have closed that to 20.9%. Two proteins are specified differently at the sister property, so this is a format comparison rather than a like-for-like one.
The occupancy terms bought a price ceiling. On the eighteen core items the realised 2025 price ran 20.9% below the sister property's list (21.8% on plates, 22.2% on salads, 14.7% on pitas), and the agreement means it cannot be moved without approval. The consequence: food cost here runs above the firm's full-service standard (28.6% of sales in 2025 and rising in 2026, Section VI) by design, against rent at 2.5% of gross with utilities inside it and no bar to subsidise the kitchen. Beverage is 5.3% of retail sales in coffee and tea and 2.5% in soft drinks; there is no 32% beverage share doing the quiet work it does in a dining room. The margin in this format has to come from throughput and from the labour line, and the operating system is built to produce both.
PEOPLERETENTION
By the operator's own account the hardest part of the operation has not been speed, efficiency or money. It has been people.
The roster is twelve: three prep cooks and a prep lead, three line cooks and a line lead, a dishwasher, and three counter attendants, one of whom is the manager. The manager works a shift every day and is on the line for most of lunch service. That is as it should be and is also, in the operator's word, excruciating. The prep lead is the highest-paid person after the manager, because she keeps the prep kitchen in line and the prep kitchen is what the assembly line eats. The line lead is the fallback for everything and is paid as one.
Retention has been good and is not claimed as a system: the turnover to date has been a pregnancy, an illness and one misalignment with one member of staff. What is a system is the cadence. A staff meeting most weeks, usually Thursday morning, where grievances are aired; an individual conversation with most people at least once a week; a weekly meeting with the manager. Several cultures work the same small kitchen and the operation makes a point of celebrating each of them. They like each other, for the most part, and go out together sometimes, which is not a metric and is also not nothing.
Labour, fully burdened, ran 38.5% of sales in 2025 (Section VI), the largest line in the operation, and the one the format's design exists to hold. The kitchen has been de-skilled as far as it can be while making most of the food from scratch. Stations are written, leads are the redundancy, and the counter has no cashier to train. That is the human-capital model: a station that holds the method, and two people who hold the station.
MARGINCEILING
The firm underwrites against a ceiling (operating cost at no more than 80% of sales) and publishes the distance from it rather than the promise of it. Here is the distance, from the partners' own monthly books.
| 2025, full year | Jan-Jun 2025 | Jan-Jun 2026 | |
|---|---|---|---|
| Sales — retail and wholesale | $1,540,386 | $769,833 | $835,879 |
| Operating cost, all in | $1,290,309 — 83.8% | $627,564 — 81.5% | $730,937 — 87.4% |
| Operating earnings, before financing | $250,077 — 16.2% | $142,269 — 18.5% | $104,942 — 12.6% |
| Financing repaid — the partners' next location | $5,050 | $5,050 | $103,981 |
| Net, taken by the partners | $245,027 — 15.9% | $137,219 — 17.8% | $961 |
The partners' monthly cost-and-sales workbook, cash basis, before tax, depreciation and draws; not audited. Sales tie to the point of sale plus the wholesale invoices month by month. The 80% ceiling is the firm's underwriting standard for operating cost; this asset sits above it, and the text says why.
In 2025, the first full year, the operation returned $250,077 before financing, 16.2% of sales, and the partners took out $245,027 of it. Operating cost, all in, ran 83.8% of sales: above the ceiling, and stated as such. Like for like, the first half of 2026 against the first half of 2025: sales up 8.6%, operating cost from 81.5% to 87.4%, the margin from 18.5% to 12.6%. The whole of that movement is cost, not trade. Food and beverage went from 28.8% of sales to 31.8%; the other operating lines from 15.3% to 18.0%, of which the rent that began in the second year is about 1.3 points; payroll, fully burdened with taxes included, held near 38%. Under a price ceiling the operator cannot lift without the university's consent, a three-point move in food cost comes straight out of the margin. It is the line the operator is acting on: food has become more expensive, an increase is overdue, and the plan is a 10% price increase before the end of 2026, timed to the university's budget cycle and subject to its approval under the agreement. Ten per cent would still leave the menu about 13% below the sister property's list.
Read the numbers against the terms, and put the occupancy side in dollars. At 2.5% of gross with utilities inside it, rent here booked at about $2,800 a month in the first half of 2026. Price the same 2,451 square feet at what Palo Alto's commercial streets were asking in August 2026 ($54 to $61 a square foot a year, plus taxes, insurance and common charges) and the space would carry roughly $12,700 to $15,500 a month before utilities: 10 to 12% of this unit's sales against 2.5%, seven to ten points of margin the agreement hands back. Set against that, the price ceiling gives up about a fifth of list on every item, and four-fifths of what is served is made from scratch in the building. The two are the trade; the margin is reported after both. That is why it is not 80/20, and why, on this site and under these terms, it is still a very good number. The name is the discipline the firm publishes against, not a margin it guarantees, and a case study has to say which side of the line the asset is on.
The financing line is not this unit's cost. The loan repaid through 2026 was taken by the partners, all agreeing, to open their next location, and it is being carried on this unit's card receipts. Below the operating line is where it belongs. In the first half of 2026 this forty-hour-a-week campus operation paid the financing line in the table above from its own cash.
Basis. The partners' monthly cost-and-sales workbook, cash basis; before tax, depreciation and draws; not audited. Sales in it tie to the point of sale plus the wholesale invoices month by month, within 0.3% for the year. The line items are not published (this is the outcome, not the ledger), and two questions of basis are open in the source of record.
EXPOSUREMITIGATION
A format this lean has fewer places to fail and fails harder in each of them. Five exposures were designed against rather than insured against, and two of them were found the hard way before they were designed against at all. That is Section VIII.
| Exposure | Structural mitigation |
|---|---|
| Demand that arrives all at once | Four kiosks cap how many orders can enter the system at once; a queue of ten at each is the governor, not a failure. Online orders are slotted to a ticket time and throttled at the peak automatically. Two more kiosks were planned and deliberately not added. |
| A system that dies with the connection | Kiosks, displays, payment and text fulfilment all ride on the internet, and when it went down the operation stopped. Two independent backup connections were added, and a printer stands at every station as the fallback when a display fails; a failure now lasts a minute or two and costs no trade. |
| Hardware failure at the worst minute | A kiosk screen and a ticket printer have each failed in service; the printer jam is the worst case because it is silent. Spares are held on site and stations are interchangeable, so one failure does not stop the line. |
| Staffing volatility on a campus | Stations are de-skilled and written down; a prep lead and a line lead are the fallback for everything; a weekly all-hands and weekly one-to-ones. Turnover to date: a pregnancy, an illness and one misalignment. |
| A price ceiling under the agreement | List prices sit about a fifth below the sister property and cannot move without the university's approval. Accepted against occupancy at 2.5% of gross with utilities inside it, and no rent in year one. The consequence is a food cost above the firm's full-service standard, carried knowingly; a 10% increase is planned for the end of 2026, subject to approval. |
HINDSIGHTREVISION
What worked is repeatable by anyone with the drawing. What is worth paying for is the list of what broke, and what it cost to find out.
The whole operation hangs on one wire. Kiosks, displays, payment and fulfilment all ride on the internet, and when the connection failed, the restaurant stopped. Two independent backup connections were added afterwards, which is the right fix and should have been the opening specification. With them in place a failure now lasts a minute or two: tickets bunch on the display, the line moves faster for a moment, and no trade is lost. The cost is a headache for the staff, not a number in the books.
Hardware fails silently. A kiosk screen failed and was replaced. A ticket printer jammed, which is the worst case because a stuck printer does not announce itself to the line. The remedy was a backup at every station and interchangeable stations, so no single failure stops service.
The proposal was written for a restaurant that was not built. It promised a dedicated cashier alongside three to five kiosks, table delivery for guests with time, and evening hours to seven. None survived. The cashier went before opening; table delivery never started; the evening trade a research campus was supposed to provide did not exist, and the morning one did (coffee and tea alone are 5.3% of retail sales), so the doors opened at nine and closed at five from the first day, and have never done otherwise. Each change was right. Each was also a sign that the format had been modelled from the sister property's habits rather than from this building's.
A no-interaction system is harsh on the person who does not know it, will not learn it or wants to talk. The operator enforces it anyway, for the nine hundred and ninety-nine, and says so. The staff do not take kindly to the exception. It is the correct trade and it is still a trade; a future version of this format should decide, before opening, exactly how the thousandth guest is handled, rather than leaving it to whoever is on the counter.
Tickets are not people. Asked for the crunch, the operator said two hundred-odd; the export said 124. Both were right. He was counting people across the lunch, the display counts tickets in an hour, and the first draft of this document set one against the other as if they were the same unit. The correction took a conversion the point of sale already held, 1.8 items and one main to a ticket, and it is why this practice names the unit before it quotes the number. The same export settled the claim that mattered more, and in his favour: the line is fastest under load, which he had said and could not prove.
What the pattern says
Three of the five are the same failure: a dependency accepted by default rather than designed: on a connection, on a printer, on a proposal's assumptions. The fourth is a cost accepted on purpose. The fifth is the reason this practice names its units before it quotes them. The operating system did its job; what nearly undid it were the parts that were bought rather than drawn. That is the argument for doing this work before a door opens, and it is the reason the firm's fast-casual blueprint now specifies redundancy (connectivity, printers, stations) as a line item.
OPERATORRECORD
Every claim in this document has a person attached to it. Nothing of this kind traded on this site before 23 September 2024, and the operator had not run this format, a campus, or a kitchen at this speed before it. The order flow, the kiosk count, the holding standards, the roster and the mistakes in Section VIII are his work, in a partnership.
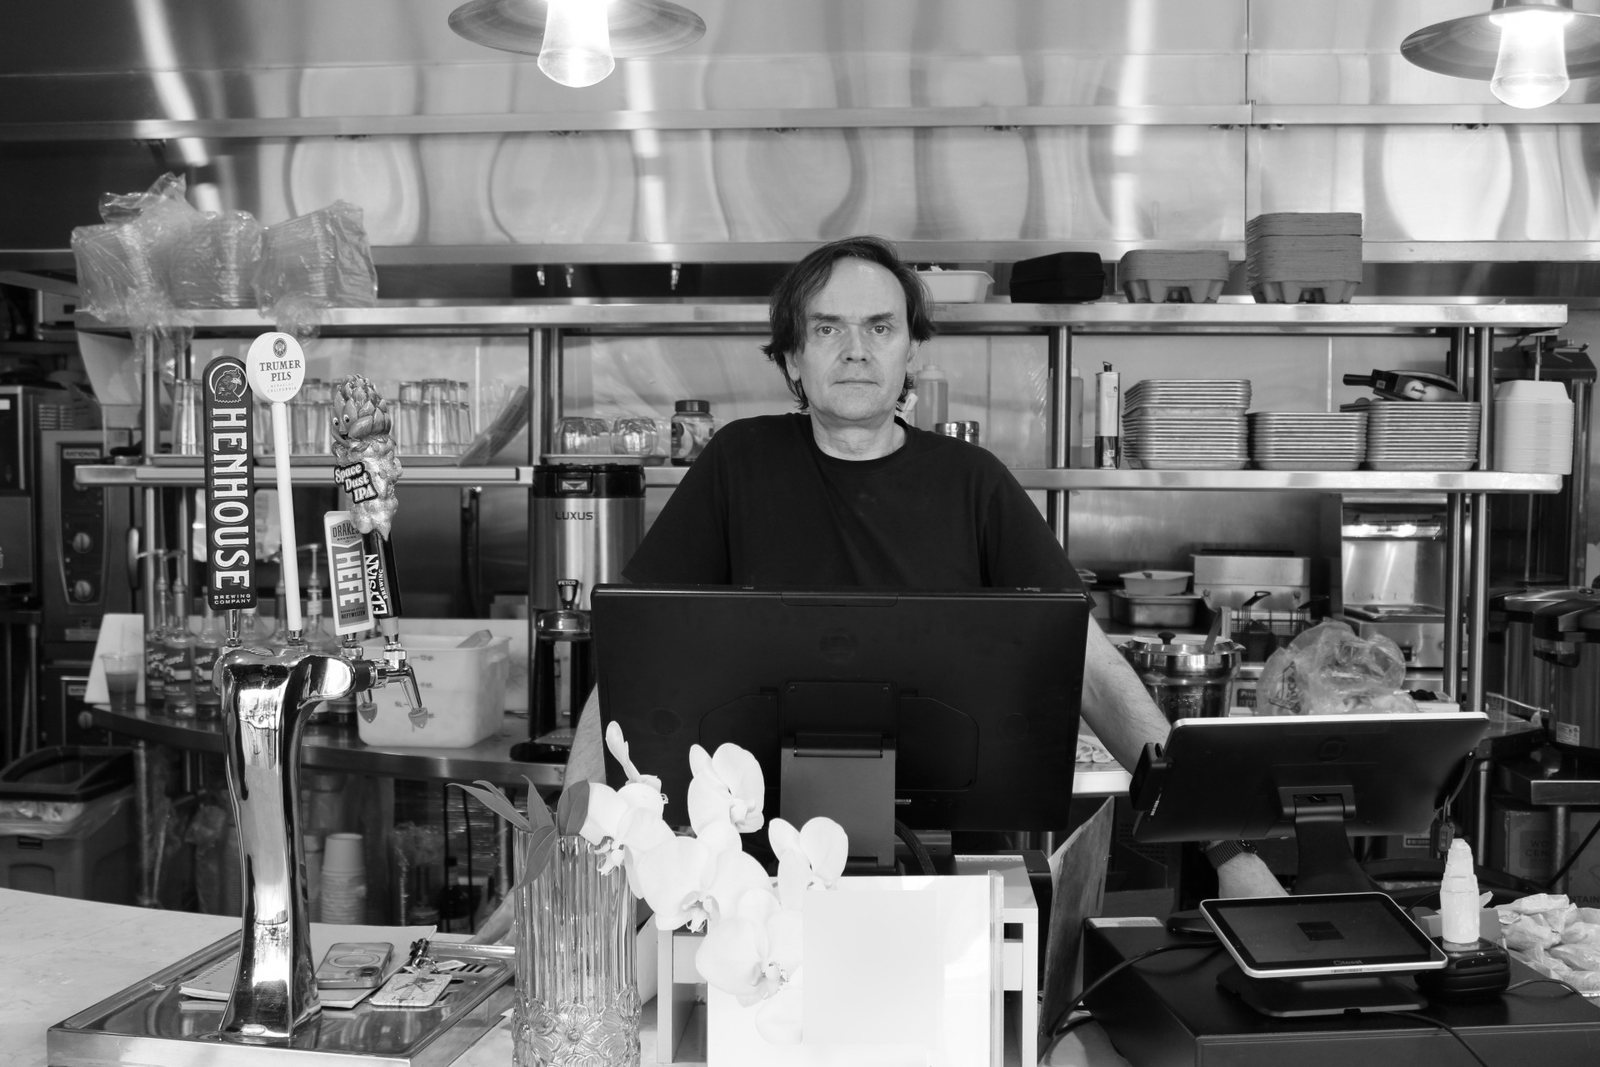
Torsten Schulz
Chief operating officer and partner in the operating entity. Drew the layout and the order flow, set the menu architecture and the holding standards, and has worked the floor since opening.