A fine Spanish eatery
Ground-up development of a fine Spanish eatery in Northern California, underwritten and operated as a cash-flowing asset rather than a concept.
BRIEFBLUEPRINT
Hospitality is underwritten badly because it is underwritten as taste. The engagement began by treating the concept as what it is to the person paying for it: a leased envelope that must service its rent, its debt and its return without depending on the continued enthusiasm of any individual.
Two constraints were set before a single drawing was made.
The cost ceiling. Total operating expense never exceeds 80% of sales. The original model targeted a 20% net operating margin. Year one was underwritten at sixteen per cent instead — fully burdened, with workers' compensation, liability, utilities and municipal waste each broken out rather than absorbed into a contingency line. The gap between the two numbers is deliberate. It is the absorption capacity for staffing friction, supply variance and the utility bills nobody models correctly in year one.
The spatial method. The 20% of layout and operating sequence that governs 80% of covers and cost is isolated first, and everything else is subordinated to it. Staff are not asked to move faster. The kitchen, the menu and the terminal routing are drawn so that the footsteps, the verbal coordination and the queueing that consume a service simply are not there to be performed.
Identity as a pricing instrument
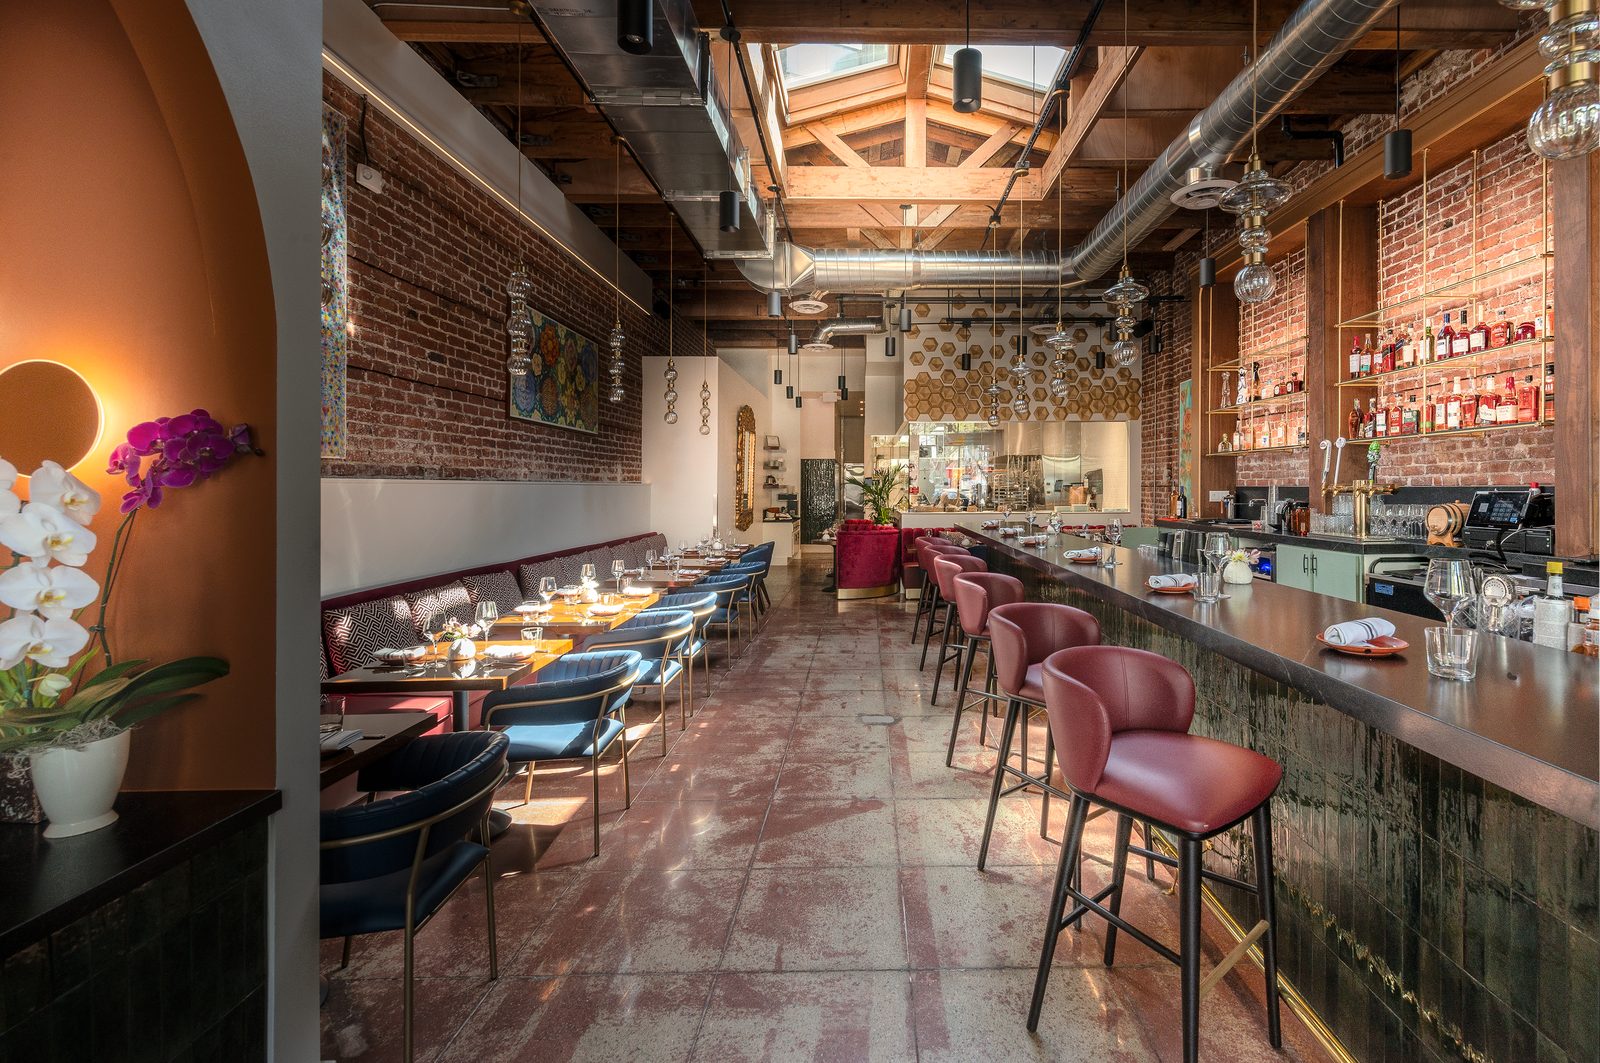
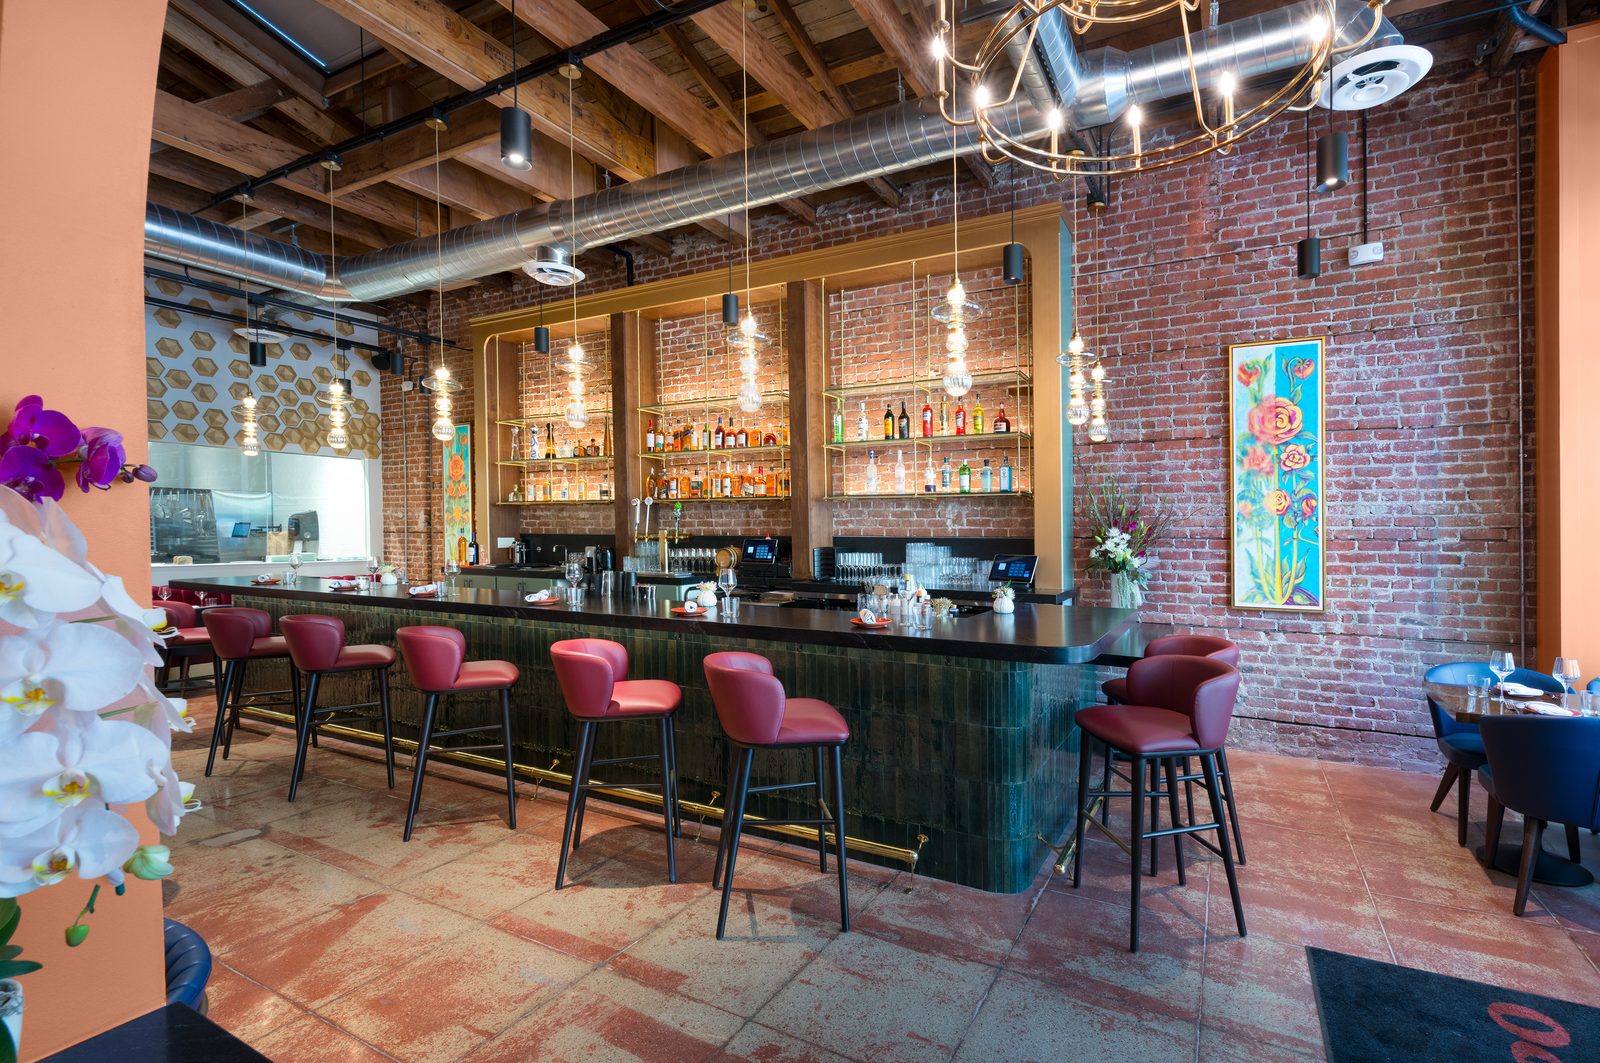
Brand work here sets the price the room can ask before the guest reads a menu. The concept was built on the Sage archetype — an authority on Valencian and Spanish regional cooking — because that register supports a $46 shared paella and a $29 octopus in a secondary market. The room reads as a study rather than a restaurant dining room. The effect is that price resistance is settled at the door instead of at the table.
The palette is agricultural and stabilising: Jamón (#560E0E), a burgundy that cues Spain's most expensive charcuterie; Tierra, a charcoal; Verde, an olive that bridges Spanish groves to Livermore's vineyards; and Sol (#E9B424), a saffron yellow. Typography pairs Moulin, for wordmarks, against Graphik (Christian Schwartz, Commercial Type) for every piece of running copy and menu text.
FRICTIONFLOW
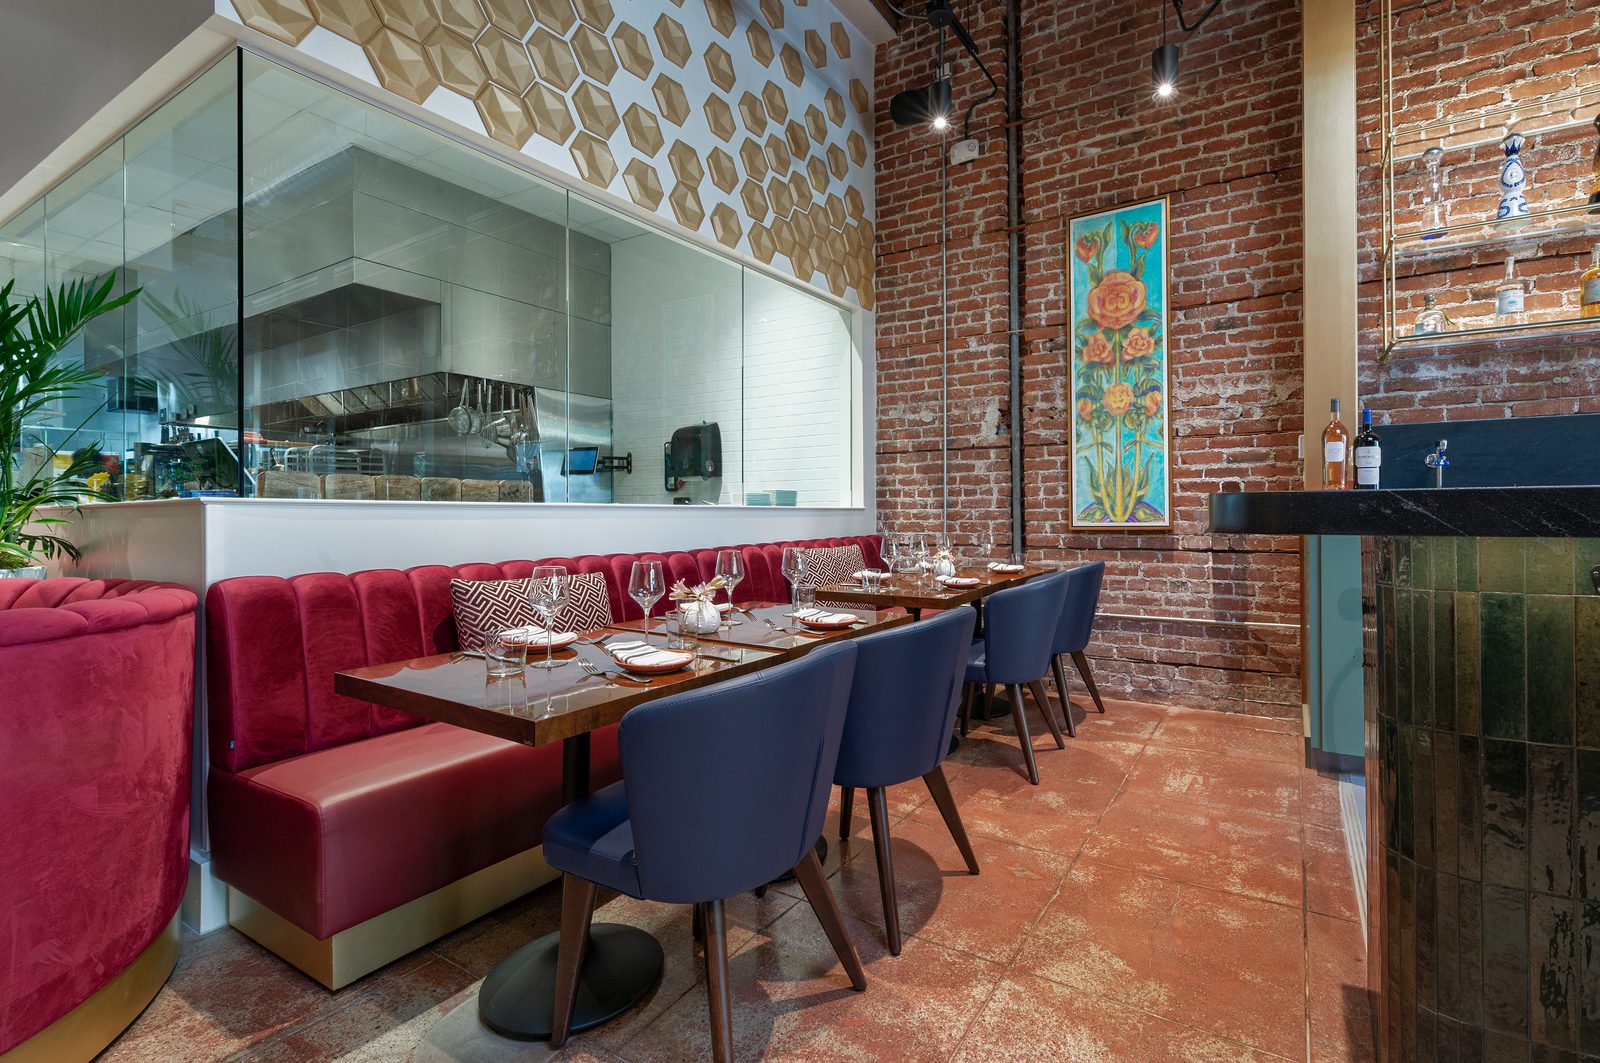
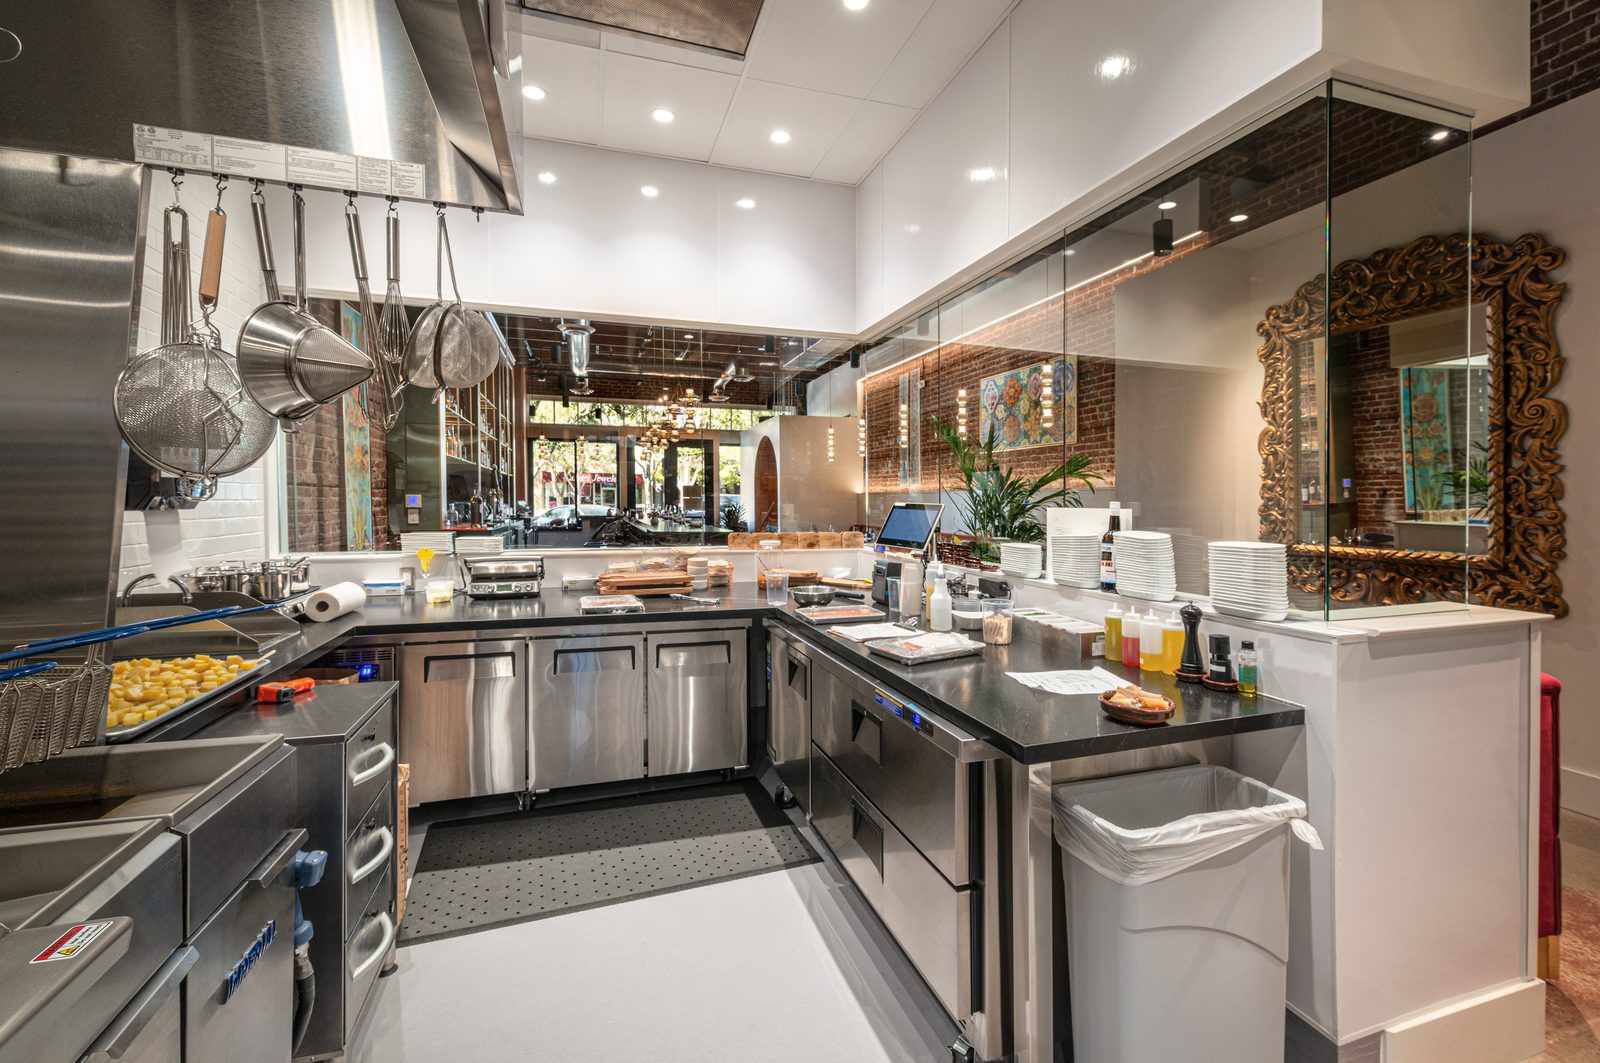
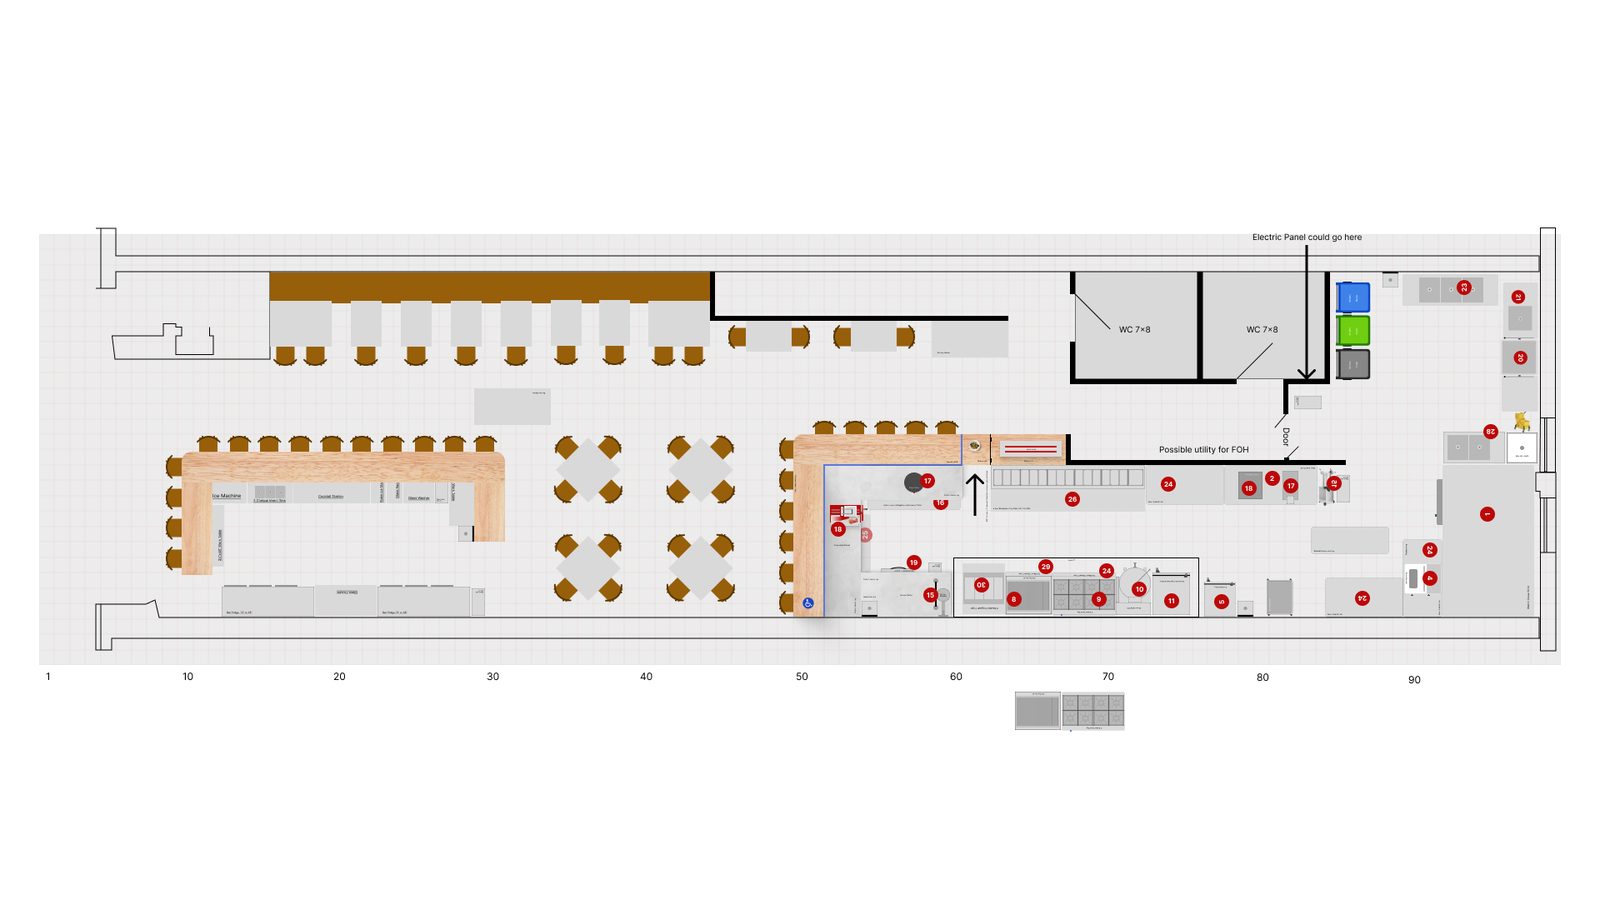
Commercial kitchens are usually drawn around the habits of the chef who will open them, which is why they generate shouting and walking. This back-of-house was drawn around the preparation sequence of the menu instead. Stations are independent: each holds its own refrigeration, its own mise and its own terminal, and a cook completes a ticket without crossing the aisle.
The room measures 95.0 ft by 24.9 ft between exterior walls — 2,370 square feet. That envelope took $1,999,179 in net sales across its first twelve months — $843 per square foot, against a full-service benchmark near $450.
The terminal network
Paper tickets and verbal expediting were removed rather than managed:
- Seven handheld terminals on front-of-house staff. Orders fire from the table at the moment of decision, and payment is taken in the same place.
- Five mounted kitchen display screens across the tapas station, the paella station and prep. Tickets route silently to the cook who owns them.
- Three cash and printer stations at service nooks, so receipt handling never crosses the kitchen threshold.
The network holds station independence in place and produces the execution speed the 19.0% back-of-house labour ceiling depends on.
COSTYIELD
The menu is a financial instrument. It runs a deliberate cross-subsidy: high- volume, low-cost items are engineered to a margin large enough to carry the premium proteins that bring the table through the door. Blended food cost is engineered to 24.0% at the recipe level; the ledger in Section VIII carries the burdened actual.
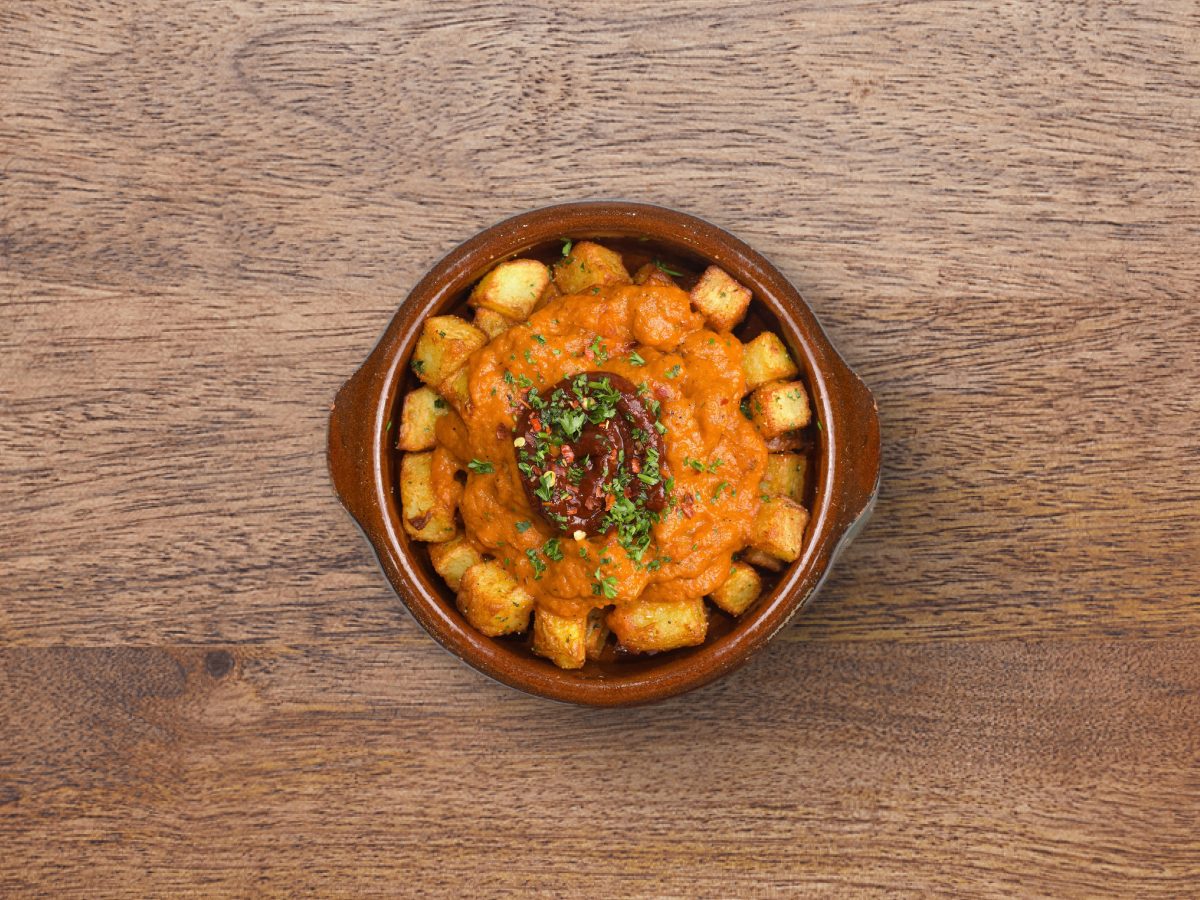
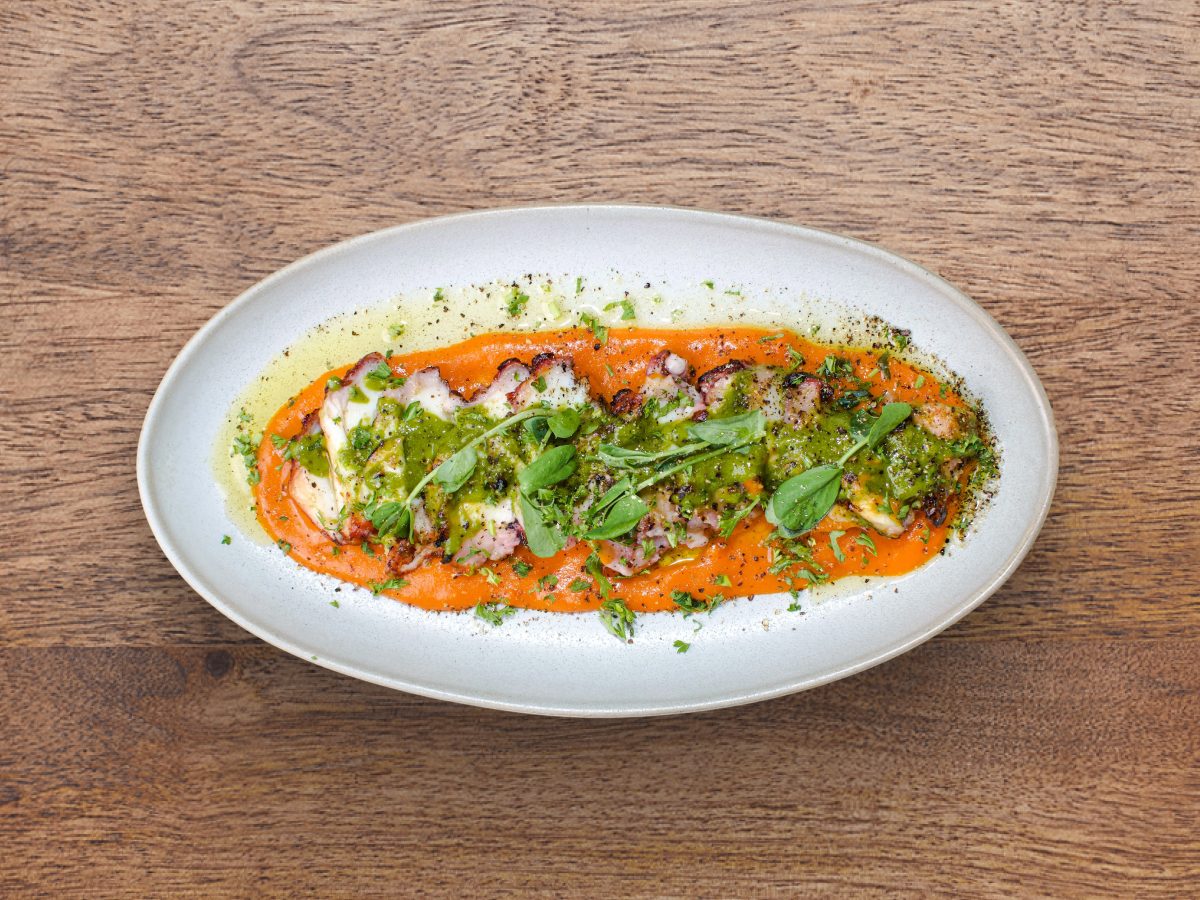
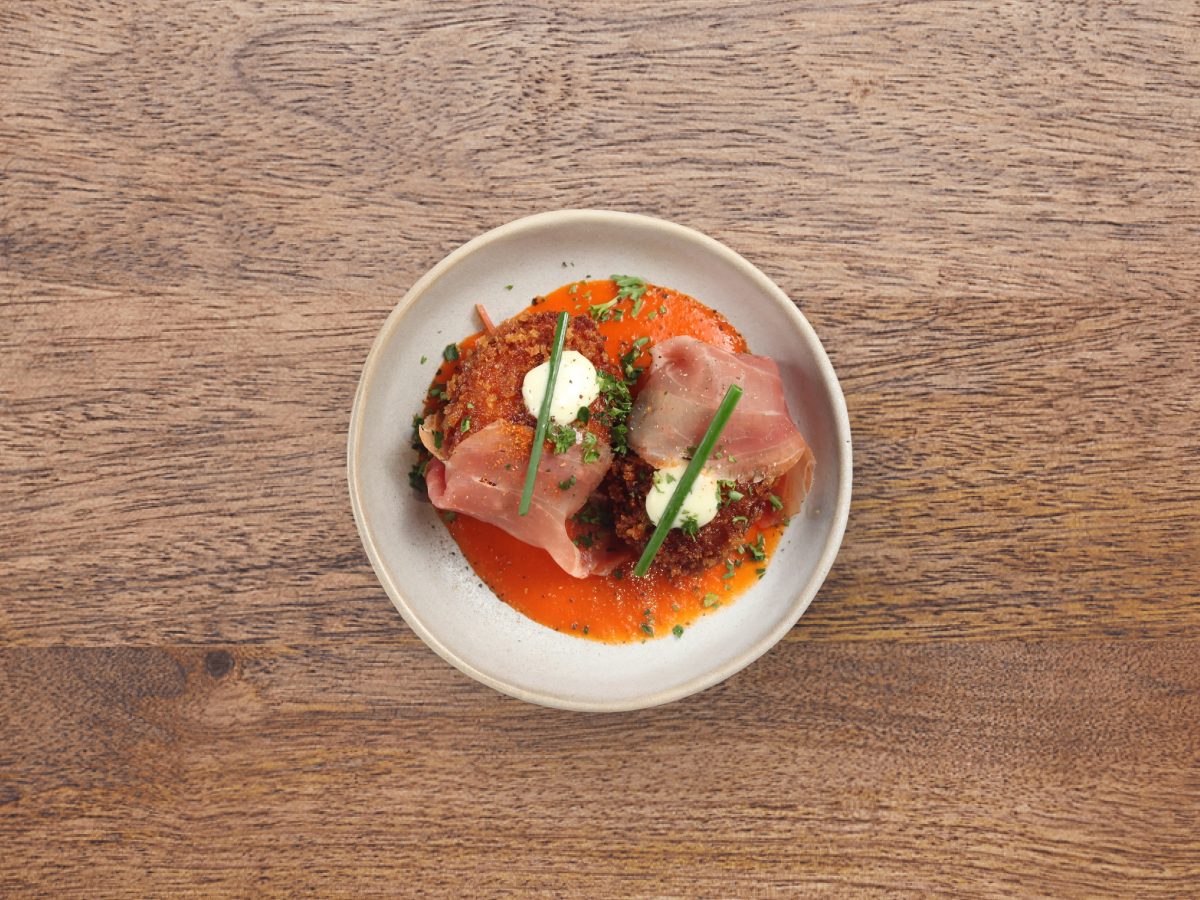
Patatas Bravas returns $12.21 a plate on a $14.00 price — a 12.8% food cost across 4,723 covers. The octopus runs at 34.1% and is kept there deliberately.
Across the year the anchor returned $46,690 of gross margin and the traffic driver $46,065 — a difference of $625 on a menu of forty-odd items. The two items are engineered to contribute the same amount by opposite routes, so the ticket is protected whichever way the guest orders.
| Item | Price | COGS | Food cost | Units | Gross margin |
|---|---|---|---|---|---|
| Patatas BravasHigh-yield anchor | $14.00 | $1.79 | 12.8% | 4,723 | $46,690 |
| Grilled Spanish OctopusTraffic driver | $29.00 | $9.89 | 34.1% | 2,640 | $46,065 |
Plate costs are the March 2026 costings; volumes and revenue are the twelve-month product mix.
The large-format paella programme
| Item | Price (shared) | Plate cost | Food cost | Units (Yr 1) | Revenue | Gross margin |
|---|---|---|---|---|---|---|
| Seafood Paella (prawns, mussels, clams) | $46.00 | $8.85 | 19.2% | 3,171 | $146,299 | $118,236 |
| Four Mushroom Paella | $38.00 | $11.99 | 31.6% | 860 | $33,366 | $23,055 |
What food actually costs
Forty-three plates are costed to the ingredient. Weighted by twelve months of actual unit volumes, and covering 69% of all food revenue, they resolve to a theoretical food cost of 24.20%.
| Cost of goods, from the costings | |
|---|---|
| Plates costed to the ingredientMarch 2026 costings | 42 of 43 |
| Food revenue covered69% of all food sales | $915,974 |
| Weighted theoretical food costEach plate weighted by twelve months of actual volume | 24.20% |
| Implied beverage costWhat the bar must run at for the blend to hold at 24.0% | 23.60% |
| If beverage cost is | Blended COGS becomes |
|---|---|
| 20% | 22.85% |
| 22% | 23.49% |
| 24% | 24.13% |
| 26% | 24.77% |
| 28% | 25.41% |
For the ledger's blended 24.0% to hold across food and beverage together, the bar has to run at 23.6% — an unremarkable number for a programme selling 17,421 signature cocktails a year. The costings corroborate the target rather than being fitted to it.
The gap between the recipe and the invoice
These are recipe costs, not counted costs, and the difference is where most restaurants quietly lose their margin. Rather than wave at it, here it is priced. Two lines are counted from the point of sale; four are industry rates applied to $320,121 of implied food purchases, and each is held at the bottom of its normal range because the operating model earns that.
| Where the margin goes | Per year | Points of food cost | Basis |
|---|---|---|---|
| Voided dishes actually fired25% of $48,684 of voids across 2,887 items assumed to have been cooked before the void was rung | $2,945 | 0.22 | COUNTED |
| Employee meals3,166 meals at zero revenue, costed at $3.25 of food each | $10,290 | 0.78 | COUNTED |
| Waste, spoilage and trim3.0% of purchases. Scratch kitchens run 4-10%; outsourced prep and the stock pipeline hold the bottom of the range | $9,604 | 0.73 | INDUSTRY |
| Over-portioning drift2.0% of purchases against a 2-5% norm. Pre-portioned protein and posted portions hold the low end | $6,402 | 0.48 | INDUSTRY |
| Unrecorded consumption1.0% against a 1-3% norm, over and above the counted staff meals | $3,201 | 0.24 | INDUSTRY |
| Yield variance on fresh items1.0%. Fish, produce and herbs are not outsourced and hold no fixed yield | $3,201 | 0.24 | INDUSTRY |
| Total variance | $35,643 | 2.69 |
Theoretical 24.20% becomes an actual 26.89% — 2.69 points, $35,643 a year. Blended with beverage, a real year lands near 26.6% against the 24.0% target, and the difference is worth $52,471 of net operating income.
Every line in that spread sits at the floor of its range rather than the middle: 3% waste where a scratch kitchen runs four to ten, 2% portioning drift where the norm is two to five, 1% shrinkage against one to three. That is the entire return on the outsourced prep, the fixed portions and the stock pipeline in Section VI — roughly three points of food cost that a conventional kitchen never sees again.
The single largest line is not waste at all. It is $10,290 of employee meals — a deliberate policy, not a leak, and one that stays in the number because pretending otherwise would make the rest of the arithmetic dishonest.
What the room actually sells
Measured across 120,478 items in year one:
| Category | Net sales | Share | Items |
|---|---|---|---|
| Food | $1,322,815 | 66.2% | 69,632 |
| Alcohol | $589,681 | 29.5% | 37,632 |
| Non-alcoholic beverage | $51,767 | 2.6% | 8,681 |
| Open-key items | $34,970 | 1.8% | 1,367 |
Beverage at 32.1% of net sales — alcohol alone at 29.5% — is what a cross-subsidised food menu is for. Food carries the concept and fills the room; the bar carries a disproportionate share of the margin on 37,632 drinks that require no line cook. The signature cocktail programme alone returned $267,936 on 17,421 covers.
The 1.8% sitting under open-key items is $34,970 of revenue rung on manually keyed buttons: chef's tasting menus at $220 a head, Louis XIII at $175 a pour, corkage, private dining charges and one-off large-format dishes. The average ticket on that line is $26.34 against $16.69 across the house — it is the most valuable revenue in the building, and it has no menu button, no price architecture and no one selling it deliberately. Structuring it is the cheapest growth available here.
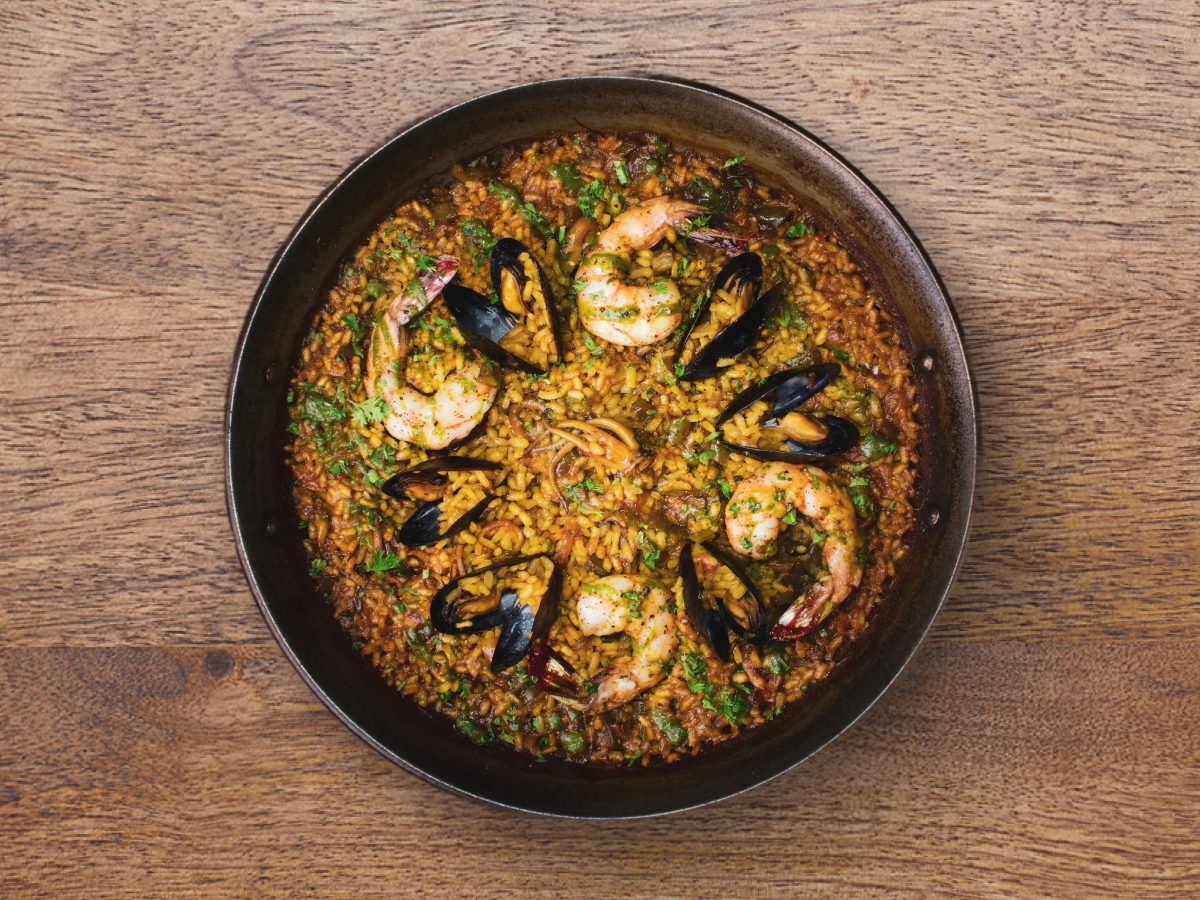
Large-format paella inverts the usual arithmetic of premium seafood by serving it over rice, shared. The Seafood Paella runs a 19.2% food cost and returned $118,236 of gross margin from one line. The four-mushroom version exists for a narrower reason: it holds the large-party booking that would otherwise be lost to one guest's dietary constraint.
DRIFTPACING
Capacity is bounded by time, not by seats. The measure is revenue per available seat hour, and the failure mode in full service is table drift — a party that occupies a four-top for two and a half hours during the only period of the week when the seat is worth anything.
A 90-minute window is the target. Across 14,758 table-service covers in year one the measured average was 97 minutes — seven minutes of drift over twelve months.
The mechanism is the paella itself. Valencian paella takes 25 minutes from raw, which in most kitchens is a liability. Here that interval is scheduled: tapas land inside eight minutes and occupy exactly the span the paella needs, so the guest experiences continuous service and the kitchen experiences none of the pressure that usually produces it. Year one closed at 39,921 guests, an average party of 2.54, and $50.08 per guest.
Where the revenue actually is
The firm is named for a ratio, and the POS data states it plainly. Sales are not spread across the week or the day; they are concentrated, and the whole operating model is built to be present at the concentration and cheap everywhere else.
- Five hours carry 81.4% of the year. 16:00 to 21:00. The rest of the trading day carries the remaining 18.6%.
- Two days carry 50.4%. Friday and Saturday. Add Sunday and three of six trading days carry 65.7%.
- Monday is dark — 1.2% of sales, and closed by design rather than by accident.
This is why the roster doubles at the weekend rather than staffing flat, and why the labour line survives contact with a slow Tuesday.
The room is already at its ceiling on Saturdays
Capacity is 47 seats inside, 8 on the sidewalk, and 26 on a seasonal street patio — 55 core, 81 with the patio open.
| Seating | Seats |
|---|---|
| InsideThe leased envelope | 47 |
| SidewalkOutside the lease | 8 |
| Street patioSeasonal, outside the lease | 26 |
| Core capacityPatio closed | 55 |
| Full capacityPatio open | 81 |
| RevPASH — revenue per available seat hour | Measured |
|---|---|
| Patio open202 trading days, 81 seats | $12.74 |
| Patio closed117 trading days, 55 seats | $18.18 |
| Blended, full year | $14.28 |
| Guests per day | Average | Turns @55 | Turns @81 |
|---|---|---|---|
| Sat | 193 | 3.51 | 2.38 |
| Fri | 170 | 3.09 | 2.10 |
| Sun | 125 | 2.27 | 1.54 |
| Thu | 95 | 1.73 | 1.17 |
| Wed | 87 | 1.58 | 1.07 |
| Tue | 80 | 1.45 | 0.99 |
A 97-minute turn allows 3.09 seatings inside a five-hour peak window. Fifty- five core seats can therefore deliver about 170 guests. Saturday averages 193. The weekend is already running past what the interior can physically seat, which means Friday and Saturday trade depends on the outdoor covers rather than being flattered by them.
So the constraint at the operator is chairs. The growth levers are the ones that add capacity or raise the value of a seat that is already full — the patio season, the cheque average, the private-event calendar — and not another campaign to bring people through a door they are already queueing at.
Forty-two per cent of the seats sit outside the leased envelope. Thirty-four of eighty-one covers occupy sidewalk and street rather than square footage the lease is charging for. For a developer reading this as a real-estate question, the tenancy converts public frontage into revenue-bearing capacity at no additional rent.
| Guest touchpoint | Operational effect | |
|---|---|---|
| Minute 1 | Table is seated. Server offers sangria carafes or vermouth flights. | Beverage is fired tableside and reaches the service bar within 30 seconds. |
| Minute 5 | Food order taken; rapid-prep tapas offered first. | Tapas reach the table inside 8 minutes. |
| Minute 25 | Large-format paella is delivered to the centre of the table. | The 25-minute cook time is absorbed by tapas service, so pacing does not slip. |
| Minute 65 | Paella cleared, dessert and sherry offered, cheque printed. | Payment is processed tableside in under 60 seconds. |
LAUNCHSTABILISATION
No restaurant opens correctly, and the ones that claim to are not measuring. Reaching a stabilised margin took a nine-month stabilisation period.
Menu. The opening menu carried several labour-intensive dishes that bottlenecked the line under peak load; ticket times would not hold under fifteen minutes, and the dining room slowed behind them. Ticket data and station observation drove successive cuts — garnishes simplified, portions standardised, slow and complex items removed. Ticket times fell and blended COGS settled at its 24.0% target.
Crew. The opening kitchen was staffed with experienced, expensive cooks who resisted standardisation and carried back-of-house labour above target. From Month 4, that roster was allowed to turn over and was replaced with a lower-cost, trainable one. The replacement only worked because the stations were de-skilled in parallel through sourcing (Section VI). Back-of-house labour settled inside its engineered ceiling and stopped depending on any individual.
The model itself. The nine months changed how the firm sells. The conventional arrangement — a large upfront concept fee, a binder, and a developer left alone through the launch — was abandoned. Turnkey blueprints now carry a First-Year Operational Accompaniment engagement: a reduced licensing fee against a twelve-month advisory partnership, with the team back in the asset at Month 4 and Month 9 running telemetry audits, menu review and retraining.
FRAGMENTATIONCONSOLIDATION
To insulate the model from local wage inflation and labour scarcity, raw prep was moved out of the building wherever the arithmetic supported it. This means paying a visible premium at the supplier in order to remove an invisible one on the line.
The premium buys three things that a raw ingredient does not: the labour hours disappear, yield goes to 100% with no trim loss, and the result no longer depends on who is holding the knife. Specialist butcher and prep roles come out of the roster entirely, and the stations can be run by standardised assembly cooks without any drop in plate consistency.
The counter-example
One line in this operation was not procured this way.
Linen runs at $25,000 a year — 1.25% of sales — on a five-year term. Better procurement would halve it: $12,500 a year, 0.63 points of net margin, $62,500 across the life of the agreement.
Tablecloths, cotton napkins and rented uniforms are a service category the market is steadily leaving — not on grounds of taste, but because the sector that grew through the last decade did so by removing every recurring cost that the guest does not attribute value to. A wiped table and a good napkin do not read as a downgrade to anyone under fifty. The right correction is no linen contract.
What makes it expensive is the tenor. A rate that looks acceptable in month one is a rate you have accepted sixty times, and no amount of subsequent operational skill undoes it. The kitchen can recover three points of food cost through sourcing discipline; it cannot recover a line fixed by signature until 2030. That is why procurement here is a design activity carried out before opening, and why contract tenor is underwritten as a risk in its own right.
Yield is recovered at the other end as well. Seafood trim — mussel liquor, prawn shells, fish frames — is routed to the paella stock kettles, which removes commercial seafood base from the order guide and takes a further 2.3% off paella COGS.
The sourcing ledger
| Ingredient | Raw cost | Prepped cost | Decision | Rationale |
|---|---|---|---|---|
| Premium russet potatoes | $0.72 / lb | $2.75 / lb | +$2.03 / lb | Removes 4.5 daily hours of washing, peeling and cutting. 100% yield, no trim waste. |
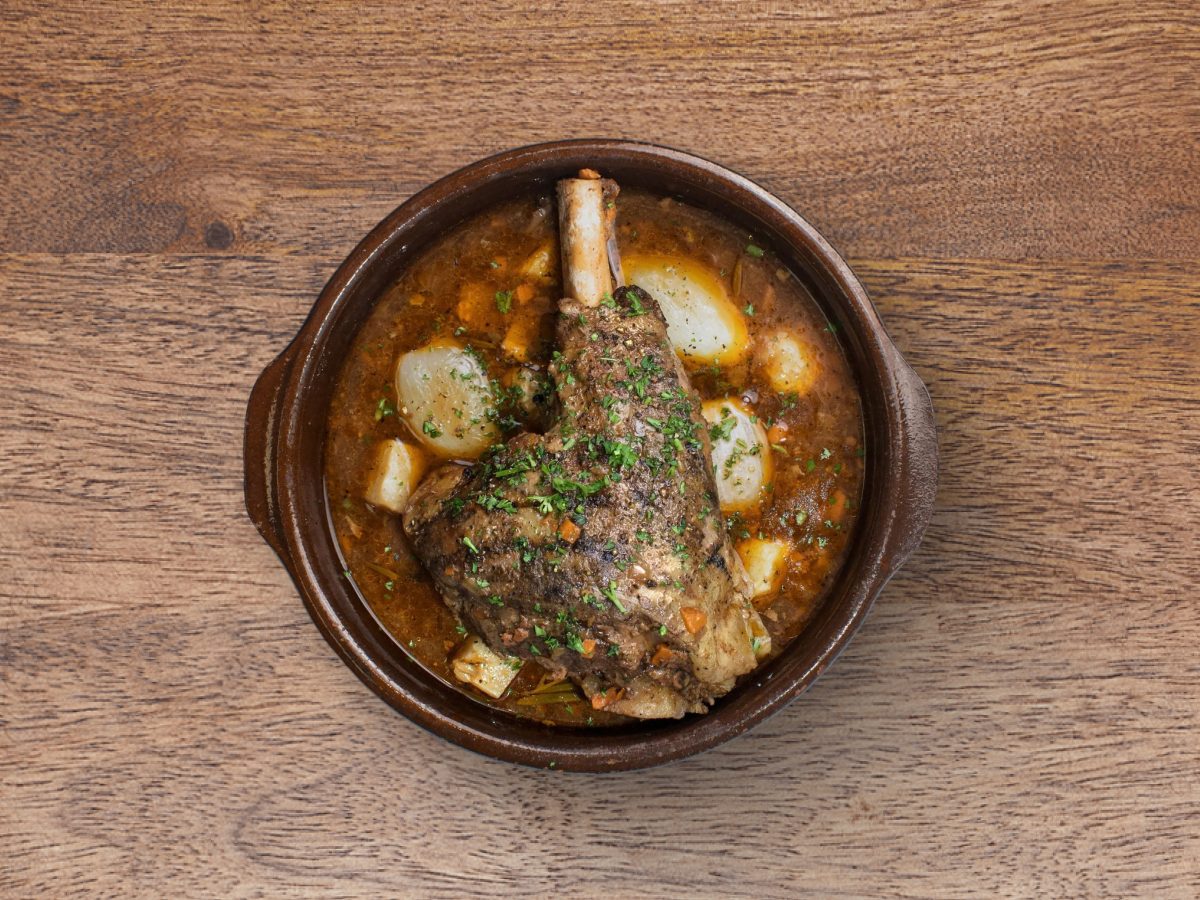
| Spanish octopus — made in house | $6.90 / lb | not bought prepped | make | Bought whole and fresh, marinated, held sous-vide for nine hours, then portioned. The one item deliberately kept in the building: the process is the product, and no supplier sells the result. |
| Strip steak, 8 oz, vacuum-sealed | $7.20 / lb | $9.39 / each | +$2.19 / unit | Pre-portioned and shelf-stable to 60 days. No cutting waste, no oxidation loss. |
TURNOVERRETENTION
Hospitality's standard failure is that the operation lives inside a few people's heads. Lose the chef, lose the consistency; lose a supervisor, lose the service standard. The blueprint's answer is to make the operation independent of who turns up.
Every position is trained to a written standard, by us. Prep lists are posted at each station, portions are specified rather than described, and cooks peer-verify at shift hand-off. A new starter reaches full station competence in seventy-two hours because the station, not the person, holds the method. The same applies on the floor: the pacing script, the tableside firing sequence and the beverage-first opening are trained, not delegated to instinct.
The consequence is a labour line that can be set as a ceiling rather than discovered at the end of the month:
- Back of house at 19.0% of sales. Held by de-skilled stations and outsourced prep, not by paying cooks badly — the blueprint assumes a wage above the statutory floor and takes its saving from needing fewer people.
- Front of house at 16.0% of sales. Budgeted as a full direct wage, so the model stands up in any jurisdiction and under any gratuity arrangement.
- Payroll expenses at 2.86%, employer taxes at 8.16% of wages.
Both are engineered ceilings — the figure a developer should underwrite, and the figure the training system exists to defend. They are deliberately set above what a well-run kitchen can achieve, because a proforma that only works at best-case staffing is not a proforma.
PROJECTIONYIELD
Revenue in the ledger below is measured: $1,999,179 of net sales over 319 trading days, from the point-of-sale record. The model that preceded it projected $2,014,500 — high by 0.77%. A proforma that lands inside 1% of a real first year is the actual product being sold here.
The ledger below is the blueprint's standard, expressed as ratios against measured revenue. It is what a developer should underwrite — not a disclosure of any particular operator's accounts.
Read the two halves differently. Everything above the line is measured: revenue, covers, cheque average, turn time, seat productivity, sales mix, all of it from the point of sale across 319 trading days. The ledger is engineered: each cost line is a ceiling the operating system is built to defend, set deliberately above best case so the model survives a bad quarter rather than requiring a good one.
Every line is set at the level the operator can be held to, not the level that flatters the model. Labour sits at ceilings materially above measured performance. Food cost is stated at realistic actual rather than the recipe figure. Merchant fees are computed on real card volume rather than assumed.
There is no "other operating expense" line, because that is where restaurant proformas go to hide. Every item is named:
- Merchant fees, 3.52%. Computed on $2,508,957 of actual card volume — American Express at 3.4%, everything else at 2.6%, plus $0.15 a transaction. This is the largest single overhead after rent, and most operators never look at it.
- Technology, 0.89%. Point of sale at $1,099 a month, Starlink at $300, Verizon at $80. The $7,000 of terminal hardware is a fixed asset and belongs in build-out capital, not here.
- Repairs and maintenance at actual spend, 1.00%, with a 1.50% operating reserve for licences, marketing, smallwares and cleaning, and a further 2.00% capital-replacement reserve taken below the operating line rather than dressed up as a cost.
Prime cost lands at 64.48% against a 65% threshold, and the operation returns 17.33% at the operating line — 15.33% distributable after the capital reserve — with every line carried, including a linen contract at roughly twice market rate. Procured at market, the same lines return 17.96% and 16.0%.
Those numbers are worse than the model this replaced, and they are worth considerably more, because not one of them rests on a figure nobody has checked.
| Operating ledger | Annual | % of $1,999,179 |
|---|---|---|
| Cost of goods soldBlended, at realistic actual: 24.0% theoretical plus the variance priced in Section III | $532,182 | 26.62% |
| Back-of-house labourEngineered ceiling, set above measured performance | $379,844 | 19.00% |
| Front-of-house labourEngineered ceiling, budgeted as full wage independent of any tip arrangement | $319,869 | 16.00% |
| Payroll expensesEmployer taxes at 8.16% of wages | $57,097 | 2.86% |
| True prime costCOGS plus fully burdened labour, on conservative ceilings. Industry threshold: 65% | $1,288,992 | 64.48% |
| Base rent$7,500 / month | $90,000 | 4.50% |
| Workers' compensation | $35,000 | 1.75% |
| General liability insurance$2,000 / month | $24,000 | 1.20% |
| Municipal trash and waste$1,400 / month | $16,800 | 0.84% |
| UtilitiesWater, gas, electric — $2,500 / month | $30,000 | 1.50% |
| Merchant feesComputed on $2,508,957 of actual card volume: AMEX at 3.4%, the rest at 2.6%, plus $0.15 a transaction | $70,395 | 3.52% |
| Technology and connectivityToast $1,099/mo, Starlink $300, Verizon $80 | $17,748 | 0.89% |
| Repairs and maintenanceActual spend. First-year plant, largely under warranty | $20,000 | 1.00% |
| Administration and professionalPayroll bureau at $131.45 a run, 24 runs | $3,155 | 0.16% |
| Reservations platformOpenTable at $100/month plus roughly 30 network covers at $1 | $1,560 | 0.08% |
| Linen serviceContracted. Market procurement for this volume is roughly half — see Section VI | $25,000 | 1.25% |
| Operating reserveLicences, marketing, smallwares, cleaning, professional fees | $29,988 | 1.50% |
| Total operating expenseEvery line named. No residual. | $1,652,638 | 82.67% |
| Net operating income | $346,541 | 17.33% |
| Less: capital replacement reserveCapital replacement, funded from operating income rather than booked as a cost it is not | $40,000 | 2.00% |
| Distributable operating cashAfter the reserve is set aside | $306,541 | 15.33% |
Year two
A 17.33% operating baseline on deliberately conservative ceilings is the number that earns the next conversation. Four avenues take the concept to its 18.0–20.0% ceiling, and each is an operating-leverage move rather than a revenue assumption.
| Avenue | Mechanism |
|---|---|
| Menu and beverage engineering | Shift sales mix toward high-yield items. Compresses blended COGS by 1.0-1.5%. |
| FOH sales and scheduling | Tableside pacing clinics and schedule tightening. Reduces direct FOH labour by 1.0-1.5% of sales. |
| Catering and private events | Large-format paella suits pre-paid, guaranteed-headcount service, which carries a 30%+ net margin. |
| Off-peak delivery | Third-party delivery between 14:00 and 17:00, when fixed overhead is already covered by dining room trade. |
EXPOSUREMITIGATION
Whatever a restaurant build-out costs — and it varies with the market, the shell and the concept — it is capital that can be stranded by four specific failures. Each was designed against rather than insured against.
| Exposure | Structural mitigation |
|---|---|
| Break-even threshold | Prime cost engineered to 64.5% against a 65% threshold, and rent locked at 4.50% ($7,500/mo). Fixed occupancy and overhead of roughly $1,100 a trading day are covered by the first twenty covers, so the asset stays profitable through off-season traffic dips. |
| Key-person dependency | Stations are de-skilled through pre-cut and pre-portioned sourcing. Standardised, peer-verified prep lists are posted at every station; an entry-level cook reaches full station competence in 72 hours. |
| Oversized lease | The concept carries $2.0M of measured revenue on 2,370 sq ft — $843 per square foot, against published full-service profitability benchmarks of $250-$325. Rent stays under 5% of sales. |
| Long-tenor service contracts | Every recurring supply agreement is priced and tendered before opening, and tenor is negotiated as hard as rate. A five-year linen contract at twice market costs 0.63 points of net margin for its whole life; the operating system cannot recover a cost that has been fixed by signature. |
| Post-launch abandonment | First-Year Operational Accompaniment places the team back in the asset at Month 4 and Month 9 for telemetry audits, menu review and retraining. |
HINDSIGHTREVISION
The parts of a finished project that worked are the least useful parts of it. They are repeatable by anyone holding the drawings. What is worth paying for is the list of things that would be done differently, and what each one cost to find out. Thirty years in, that list has not stopped getting longer, and an operator who tells you otherwise is selling a brochure.
Four things at the operator would be built differently tomorrow.
Linen should never have been a line. It was unnecessary, not mispriced. $25,000 a year, on a term that runs to 2030, for a category the industry is leaving. The error was treating it as a procurement question when it was a format question.
The opening menu was written for a kitchen that did not exist yet. Several dishes carried garnish and pick-up steps that no line could hold under peak load, and ticket times would not stay under fifteen minutes. It took successive rounds of simplification to fix, and the fix is visible in the numbers: the average cheque moved from $108.12 in the first quarter to $123.21 in the fourth — not by raising prices, but by removing the items that were slowing the room down. The menu should have been costed against station capacity before it was printed, not after.
The opening crew was hired on credentials rather than for the system. Experienced, expensive cooks who resisted standardisation, in a kitchen whose entire premise is that the station holds the method. The roster turned over from Month 4. Four months of margin bought a lesson that a single question at interview would have provided.
The point of sale was installed and never fed. Toast holds no cost data and no waste data at all, and 63% of net sales carry no category assignment. The consequence is in this document: of the six components in the food-cost bridge in Section III, only two could be counted from the operation's own records. The other four are industry rates, because the system that should have been measuring them was never configured to.
What the pattern says
Three of those four are the same mistake wearing different clothes: a decision taken once, early, without the arithmetic, that later effort cannot reverse. The menu could be rewritten and the crew could be replaced, at a cost. The linen contract cannot, and the twelve months of missing cost data cannot be recovered at all.
That is the whole argument for doing this work before a door opens rather than after. It is also why this practice sells a first-year accompaniment rather than a binder: the expensive errors are made at the desk, months earlier, by someone reasonable who did not run the numbers.
OPERATORRECORD
Every claim in this document has a person attached to it. The concept, the spatial design, the menu arithmetic, the training system and the mistakes in Section X are one operator's work.
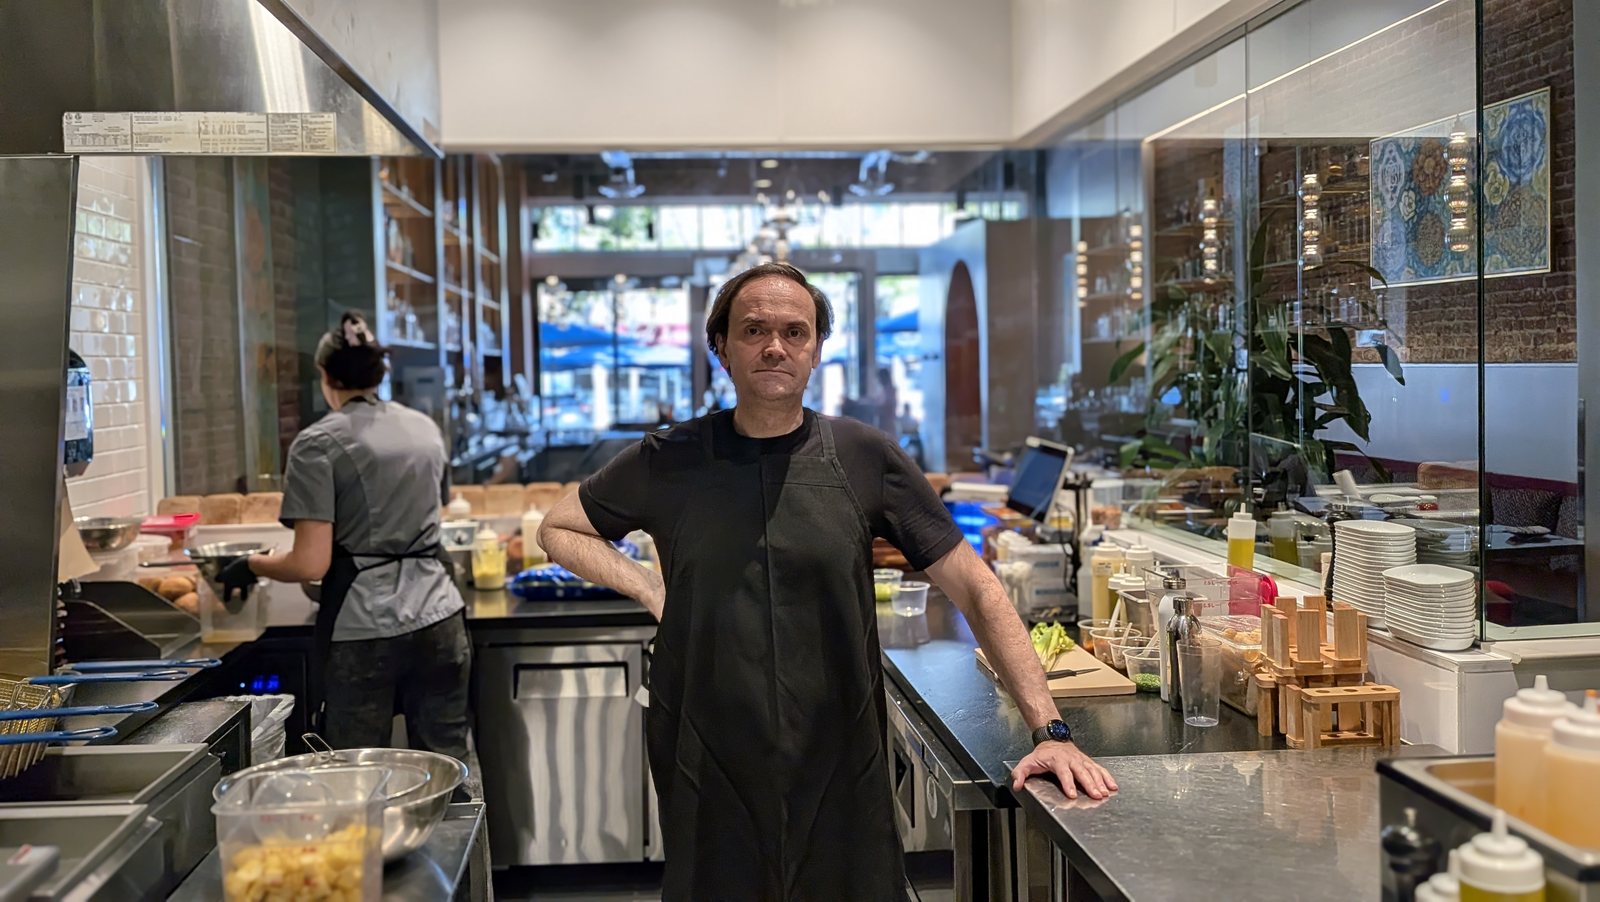
Torsten Schulz
Owner of the property in this study.